R Programming Fundamentals
Introduction to R
What Is R?
R is a programming language designed specifically for statistical computing and graphics. It was created by statisticians Ross Ihaka and Robert Gentleman at the University of Auckland, New Zealand, and is now developed by a global community.
Think of it as a powerful, specialized calculator combined with a versatile art studio. You can use it to perform complex statistical tests, model data, and create detailed visualizations. Because it's open-source, it’s completely free to use and benefits from a massive, active community that contributes to its growth.
R is a language built by statisticians, for statisticians.
Key Advantages of R
So, why choose R over other tools? A few key features make it a favorite in academia and industry.
First, its statistical capabilities are unmatched. Nearly any statistical method you can think of is available in R. Second, it has a vast ecosystem of packages. Packages are bundles of code, data, and documentation that extend R's abilities. The main repository, the Comprehensive R Archive Network (CRAN), hosts thousands of packages for everything from genetics to finance.
Finally, R is excellent for reproducible research. You can write scripts that take your raw data, process it, analyze it, and generate a final report. This creates a clear, verifiable workflow that anyone can follow.
Installing Your Toolkit
To get started, you'll need two things: R itself and RStudio. It's important to understand the difference. R is the programming language—the engine. RStudio is an Integrated Development Environment (IDE)—the dashboard and controls that make the engine easier to use.
You must install R first, then RStudio.
- Install R: Go to the Comprehensive R Archive Network (CRAN) and download the installer for your operating system (Windows, macOS, or Linux). Run the installer and accept the default settings.
- Install RStudio: After R is installed, go to the RStudio Desktop website and download the free version. Run the installer. RStudio will automatically find your R installation.
Think of it this way: R is the engine, and RStudio is the car's dashboard that lets you operate the engine effectively.
The RStudio Environment
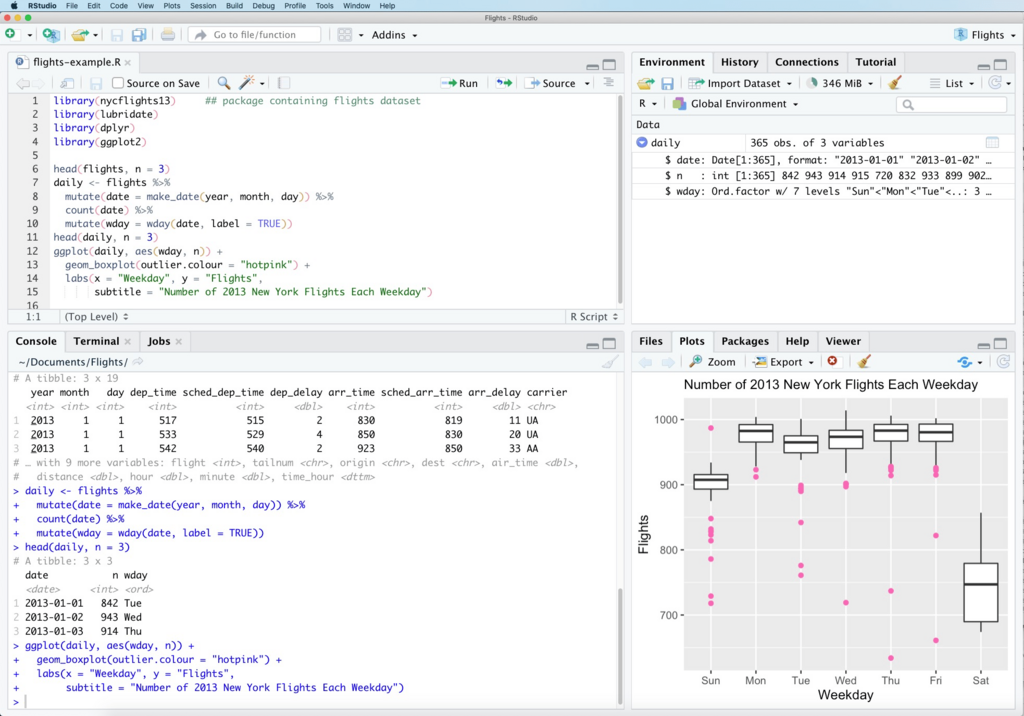
When you open RStudio, you'll see an interface divided into panes. This setup helps you manage your code, view results, and inspect your work all at once.
Here’s a quick rundown of each section:
- Source Editor (top left): This is a text editor where you write and save your R scripts. A script is just a text file with a
.Rextension containing your code. - Console (bottom left): This is where you can type R code directly and see the output immediately. When you run code from the editor, it executes here.
- Environment / History (top right): The Environment tab shows all the objects (like datasets and variables) you've created. The History tab keeps a record of all the commands you've run.
- Files / Plots / Packages / Help (bottom right): This multi-purpose pane lets you navigate your computer's files, view graphs you create, manage your installed packages, and access R's help documentation.
Let's try a simple command. In the Console pane (bottom left), type the following and press Enter:
# This is a comment. R ignores lines starting with #
# Print a message to the console
print("Hello, R!")

# Perform a simple calculation
2 + 2
You should see the message "Hello, R!" and the number 4 printed as output. You've just run your first bit of R code.
Ready to check your understanding?
What is the primary purpose for which the R programming language was designed?
What is the fundamental difference between R and RStudio?
You're now set up with a powerful tool for data analysis. In the next sections, we'll start using it to work with data.