Quantitative Analysis for Stock Trading
Introduction to Quantitative Analysis
What Is Quantitative Analysis?
Quantitative analysis, often called “quant” analysis, is a way of studying financial markets using math and statistics. Instead of relying on gut feelings, news headlines, or intuition, a quantitative analyst uses data to make trading decisions.
quantitative analysis
noun
The use of mathematical and statistical methods to analyze financial data, identify patterns, and make investment decisions.
Think of it as financial detective work where the clues are numbers. The goal is to find patterns, relationships, and trends in historical market data that can provide an edge. By turning market behavior into a set of rules and models, this approach aims to make trading more systematic and less emotional.
Quantitative finance applies mathematical and statistical methods to understand financial markets and develop trading strategies.
The Building Blocks
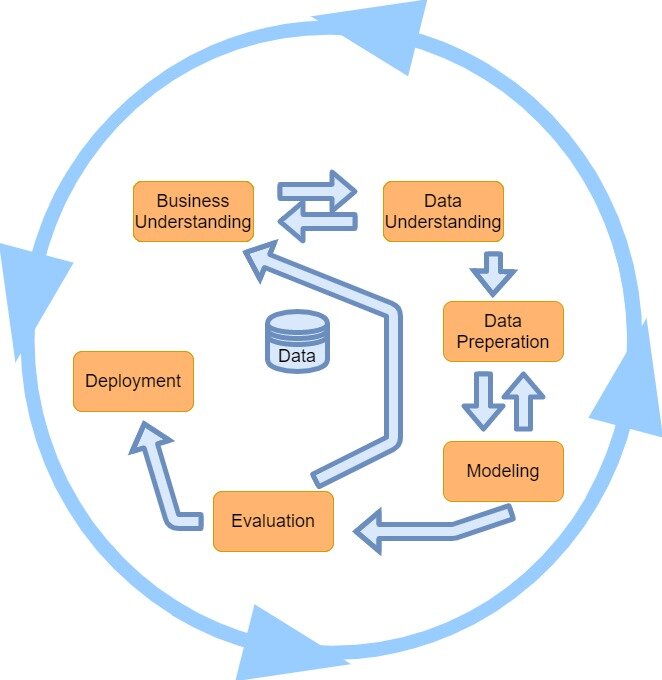
A quantitative trading strategy isn't built overnight. It relies on a structured process with three key components: data collection, statistical methods, and model development.
Good data is the foundation of any solid quantitative analysis.
First comes data collection. This involves gathering vast amounts of historical and real-time information. This could be anything from stock prices and trading volumes to corporate earnings reports and economic indicators. The quality of this data is critical; inaccurate or incomplete information can lead to flawed conclusions.
Next, analysts apply statistical methods. This is where the raw data starts to reveal its secrets. Using techniques like regression analysis, correlation, and mean-reversion, analysts test relationships between different variables. For example, they might investigate how a company's stock price tends to react to changes in interest rates.
Finally, there's model development. The insights gained from statistical analysis are used to build a trading model. This model is essentially a set of rules and algorithms that specifies when to buy or sell an asset. For instance, a simple model might generate a “buy” signal when a stock's price crosses above its 50-day moving average and a “sell” signal when it falls below.
Advantages and Limitations
Using a quantitative approach has some clear advantages. The biggest one is objectivity. Models operate based on data and predefined rules, removing the potential for fear, greed, or bias to cloud judgment. This disciplined approach helps traders stick to their strategy, even when markets are volatile.
Automation Value: Removing human emotion from trading decisions dramatically improves outcomes
Another major benefit is the ability to process large datasets. A human can only track so many stocks at once. A computer, however, can analyze thousands of securities simultaneously, uncovering opportunities that a manual approach would miss.
However, quantitative analysis isn't foolproof. A significant limitation is the risk of model overfitting. This happens when a model is so finely tuned to past data that it performs beautifully in historical tests but fails in live trading. It has learned the noise, not the signal.
There are also data quality issues. Market data can be messy, with errors, gaps, or changes in how it's reported over time. If a model is built on poor-quality data, its outputs will be unreliable. This is often summarized by the phrase “garbage in, garbage out.” Financial markets are also constantly evolving, and a model that worked in the past is not guaranteed to work in the future.
Ready to check your understanding? Let's review what we've covered.
What is the primary basis for making trading decisions in quantitative analysis?
A quantitative trading strategy relies on a structured process that includes data collection, statistical methods, and ______.