QGIS Essentials for Geospatial Data
Introduction to GIS
What is GIS?
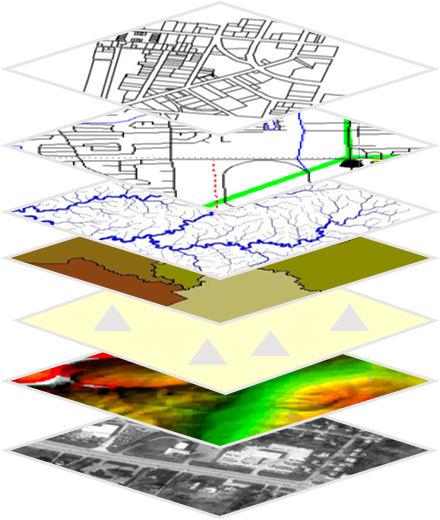
A Geographic Information System, or GIS, is a system designed to capture, store, analyze, and present all types of spatial or geographical data. Think of it as a smart map. Instead of just showing a static picture of a place, a GIS links data to locations, creating layers of information that you can explore and question.
Geographic Information Systems (GIS) are computer-based tools for capturing, storing, analyzing, and visualizing spatial data
Every GIS has five key components working together. It’s not just about the software. You need hardware to run it, data to analyze, people with the right skills, and established methods to guide the work.
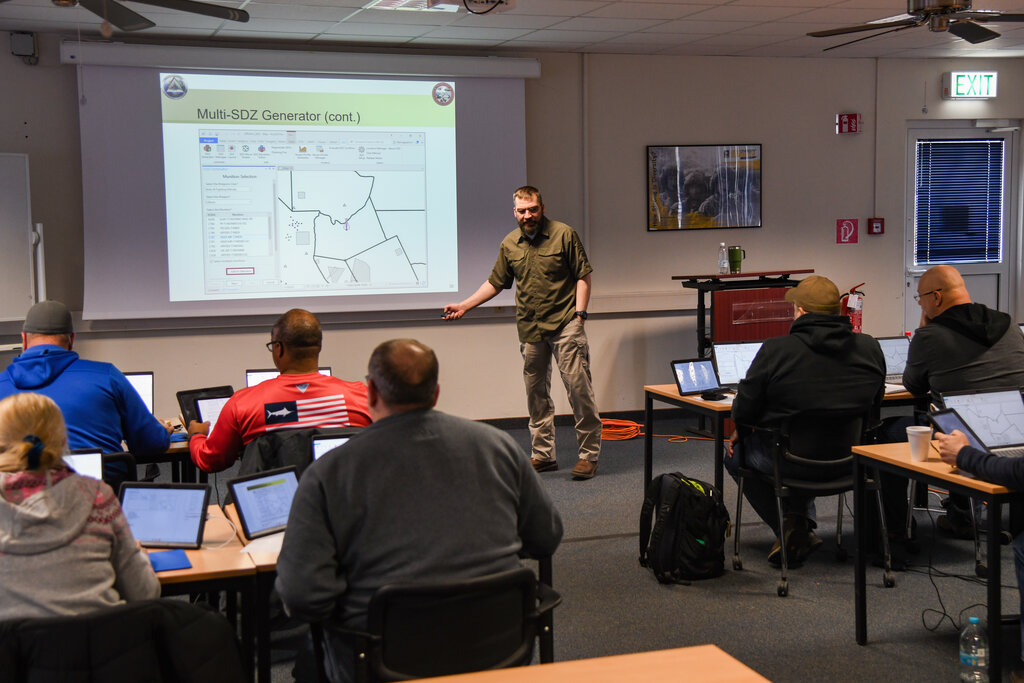
From urban planning and environmental management to marketing and emergency response, GIS helps us see, understand, and interpret data in a way that reveals relationships, patterns, and trends. A city planner might use GIS to find the best location for a new park, while an epidemiologist could track the spread of a disease.
The Two Flavors of Spatial Data
Geographic data comes in two main types: vector and raster. Understanding the difference is key to working with GIS.
Vector data uses points, lines, and polygons to represent discrete objects with clear boundaries. It's like a drawing.
Imagine you're drawing a map. You'd place a dot for a city (a point), draw a squiggly line for a river (a line), and shade in an area for a lake (a polygon). That's vector data. It's efficient for storing features like roads, property lines, and administrative boundaries.
Raster data, on the other hand, represents continuous phenomena like temperature, elevation, or satellite imagery. It's more like a photograph.
Raster
noun
A data model that uses a grid of cells, or pixels, to represent spatial information. Each cell in the grid has a value that corresponds to the feature it represents.
Think of a digital photo. If you zoom in far enough, you'll see it's made of tiny, colored squares. A raster is just like that, but instead of color, each cell holds a value, such as elevation in meters or rainfall in millimeters. Rasters are ideal for data that varies continuously across a landscape.
Where in the World?
To place data on a map, a GIS needs a way to define location. This is done using a Coordinate Reference System (CRS). A CRS is a framework used to define how the two-dimensional, flat surface of a map relates to the real, three-dimensional Earth.
Since the Earth is a sphere (or more accurately, a spheroid), we need a way to flatten it onto a screen or a piece of paper. This process is called projection. Every map projection distorts the Earth's surface in some way. Some projections preserve area, others preserve angles, but none can preserve everything at once.
Think of peeling an orange and trying to lay the peel flat without tearing it. It's impossible. Every map projection makes a compromise, distorting shape, area, distance, or direction.
Choosing the right CRS and projection is crucial. Using the wrong one can lead to inaccurate measurements and analysis. For a map of the entire world, a projection that minimizes overall distortion might be best. For a map of a single city, a different projection that is highly accurate over small areas would be more appropriate.
Asking Questions with Data
The true power of GIS lies in spatial analysis. This is the process of examining spatial data to find patterns and relationships. It’s about turning raw data into useful information by asking questions of your map.
For example, you could ask:
- Which houses are within 500 meters of a floodplain?
- Where is the highest concentration of customers for a new store?
- What is the most efficient route for a delivery truck hitting 10 different stops?
Spatial analysis combines data from different layers to answer these questions. You might combine a layer of house locations with a layer showing floodplains. Or you might overlay customer addresses on a street map. This ability to integrate and analyze different types of information based on location is what makes GIS an indispensable tool in so many fields.
Which of the following best describes a Geographic Information System (GIS)?
A dataset representing property lines, roads, and rivers would most efficiently be stored as which data type?
With these fundamentals in place, you're ready to explore how GIS software brings these concepts to life.