QEEG Market Sizing for Neurology and Psychiatry
Introduction to QEEG
Listening to the Brain's Electrical Buzz
Your brain is constantly humming with electrical activity. Every thought, feeling, and action is the result of billions of neurons firing and communicating with each other. An Electroencephalogram, or EEG, is a tool that allows us to listen in on this electrical conversation.
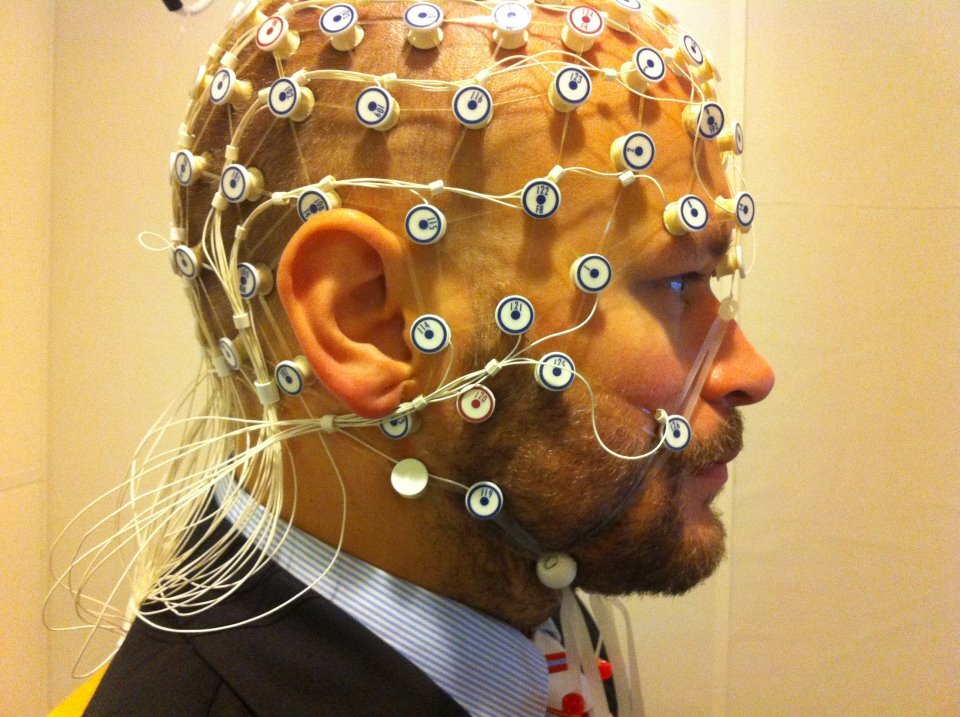
The process is non-invasive. A cap fitted with small electrodes is placed on the scalp. These electrodes don't send any electricity into the brain; they simply act like sensitive microphones, picking up the tiny electrical fields generated by neuronal activity.
The result is a series of wavy lines, often called brainwaves. These raw recordings provide a real-time look at the brain's functional state.
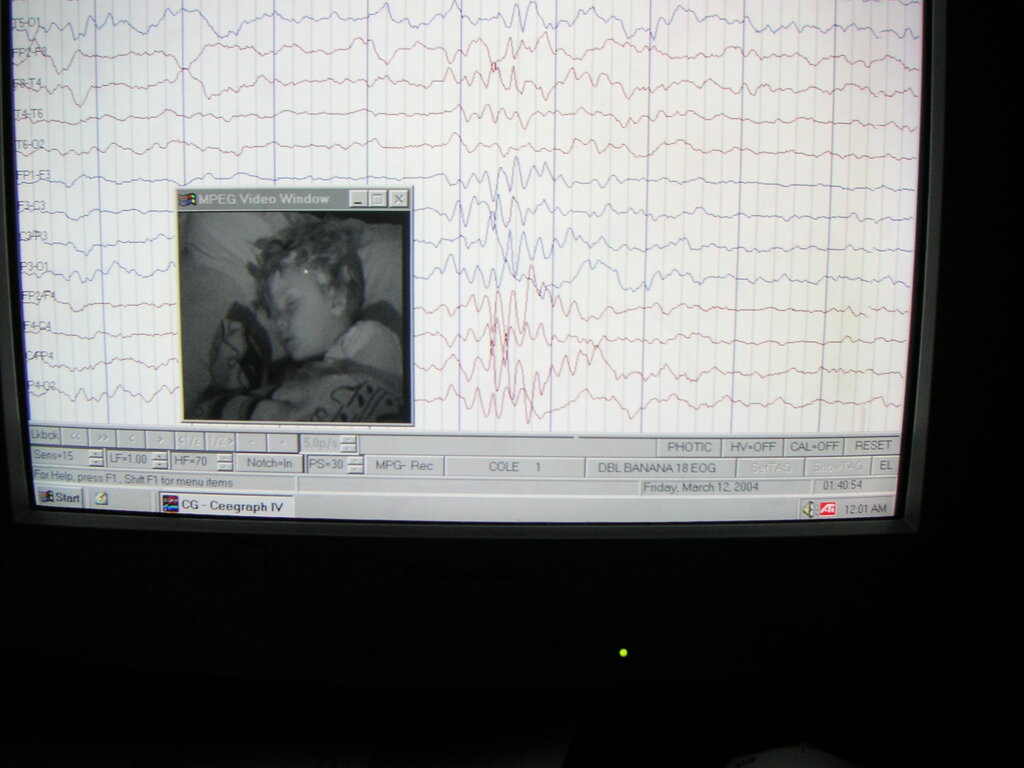
Brainwaves are categorized into different frequency bands, each associated with different mental states. Think of them as different rhythms in the brain's overall electrical symphony.
| Brainwave | Frequency (Hz) | Associated State |
|---|---|---|
| Delta | 0.5 - 4 Hz | Deep, dreamless sleep |
| Theta | 4 - 8 Hz | Drowsiness, deep calm |
| Alpha | 8 - 12 Hz | Awake, relaxed, passive |
| Beta | 12 - 38 Hz | Alert, focused, active |
| Gamma | 38 - 100 Hz | High-level processing |
Turning Waves into Data
A standard EEG provides a qualitative snapshot. A neurologist can look at the squiggly lines and spot major abnormalities like seizure activity. But what if we want a more detailed, objective picture? That's where Quantitative EEG, or QEEG, comes in.
QEEG takes the raw EEG data and subjects it to sophisticated mathematical and statistical analysis. It transforms the waves into numbers, maps, and graphs. This process filters out noise and artifacts (like muscle tension or eye blinks) to reveal the underlying patterns of brain function.
Think of it this way: An EEG is like listening to an orchestra. QEEG is like getting a detailed musical score that shows exactly which instruments are playing, how loudly, and whether they're in sync.
The analysis generates what's known as a "brain map." This is a color-coded map of the head that shows how a person's brain activity compares to a database of brain activity from a large group of healthy individuals of the same age. Red or orange might indicate too much activity in a certain frequency band, while blue might indicate too little.
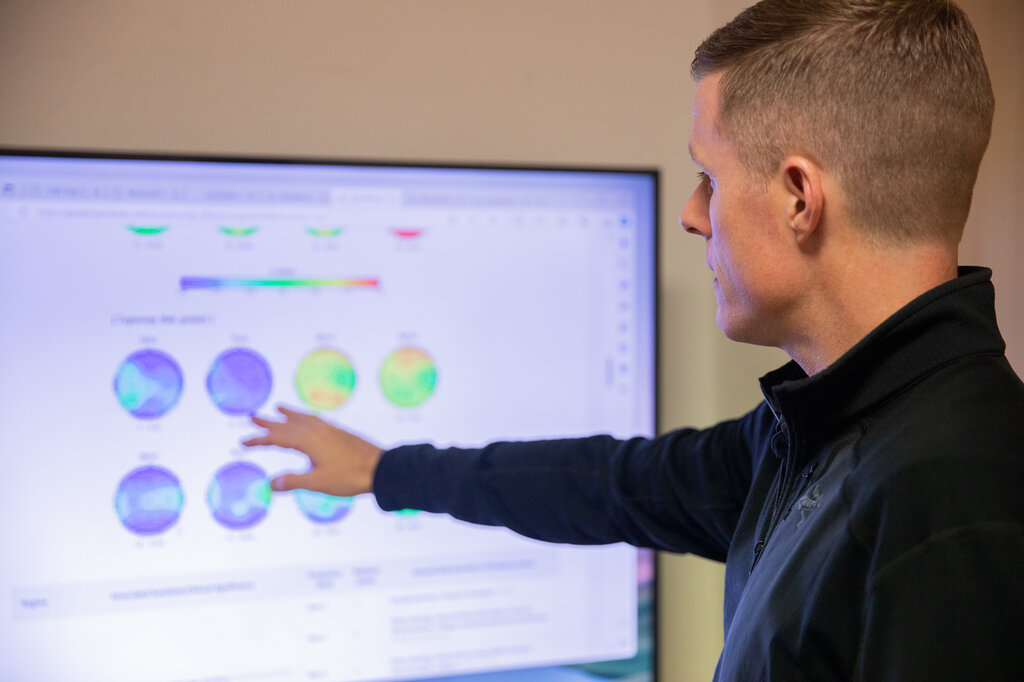
This quantitative approach allows clinicians to see subtle patterns that might be missed by visual inspection of a raw EEG. It helps identify specific areas of the brain that are overactive, underactive, or not communicating effectively.
Applications in Health
By providing a functional blueprint of the brain, QEEG has become a valuable tool in both neurology and psychiatry.
In neurology, it helps in the diagnosis and treatment of conditions that affect the brain's electrical system. For example, QEEG can pinpoint the specific area of the brain where seizures originate, which is critical information for planning treatment or surgery. It's also used to assess brain function after a traumatic brain injury (TBI) or stroke, tracking recovery and guiding rehabilitation efforts.
After a concussion, a QEEG can reveal patterns of 'slow-wave' activity, indicating areas of the brain that are struggling to function efficiently.
In psychiatry, QEEG offers a biological window into conditions that have traditionally been diagnosed based on symptoms alone. Many psychiatric disorders have characteristic brainwave patterns. For instance, individuals with ADHD often show an excess of slow-wave (Theta) activity and a deficit of fast-wave (Beta) activity in the frontal lobes, which are responsible for focus and executive function.
Similarly, patterns of asymmetry in alpha wave activity between the left and right frontal lobes have been linked to depression. This kind of objective data can help confirm a diagnosis and, more importantly, tailor treatment to an individual's specific brain patterns.
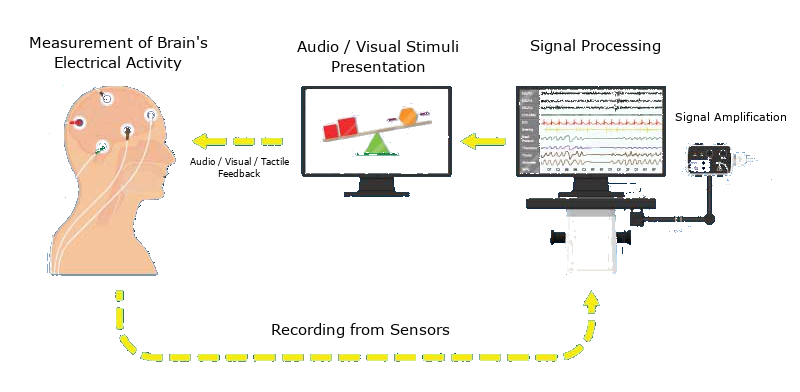
One of the most powerful applications is in neurofeedback, a type of therapy that uses real-time QEEG data to train people to regulate their own brain activity. By watching their brainwaves on a screen, patients can learn to produce more of the desired patterns and fewer of the dysfunctional ones, effectively exercising their brain back to a healthier state.
Ready to test your understanding?
What is the primary function of the electrodes used in an Electroencephalogram (EEG)?
A clinician using QEEG finds that a patient has an excess of slow-wave (Theta) activity and a deficit of fast-wave (Beta) activity in their frontal lobes. This pattern is often associated with which condition?
QEEG bridges the gap between the brain's electrical activity and clinical insights, offering a powerful, data-driven way to understand and treat the complexities of the human brain.