Python ML for Social Science Insights
Python Libraries for Data Science
The Data Scientist's Toolkit
Python is a powerful language on its own, but its real strength in data science comes from its libraries. These are collections of pre-written code that you can use to perform common tasks without reinventing the wheel. For data analysis, three libraries form the foundation: NumPy, Pandas, and Matplotlib.
When starting your data science journey, it’s recommended to start by learning two of the most useful Python packages: NumPy and Pandas.
Think of them as specialized toolkits. NumPy is for heavy-duty numerical work, Pandas is for organizing and cleaning data, and Matplotlib is for creating charts and graphs to visualize it.
NumPy for Numbers
NumPy, short for Numerical Python, is the go-to library for handling large, multi-dimensional arrays and matrices. If your data is a big grid of numbers, NumPy is your best friend. It's incredibly fast because many of its operations are written in C, a lower-level language that runs closer to the machine's hardware.
The core of NumPy is the ndarray, or n-dimensional array. It's similar to a Python list, but all elements must be of the same data type, which is what makes it so efficient. Let's create a simple NumPy array.
import numpy as np

# Create a 2x3 array (2 rows, 3 columns)
my_array = np.array([
    [1, 2, 3],
    [4, 5, 6]
])

print(my_array)
With this array, you can perform mathematical operations on every element at once, a concept called vectorization. For instance, if you wanted to add 10 to every number in the array, you don't need a loop.
# Add 10 to every element
new_array = my_array + 10

print(new_array)

# Output:
# [[11 12 13]
#  [14 15 16]]
This is much faster and cleaner than writing a for loop to iterate through each element. NumPy is the bedrock for many other data science libraries, including Pandas.
Pandas for Data Structures
While NumPy is great for raw numbers, most real-world data isn't just a grid of numbers. It has labels, mixed data types (like text and dates), and missing values. This is where Pandas comes in. Pandas introduces two primary data structures: the Series and the DataFrame.
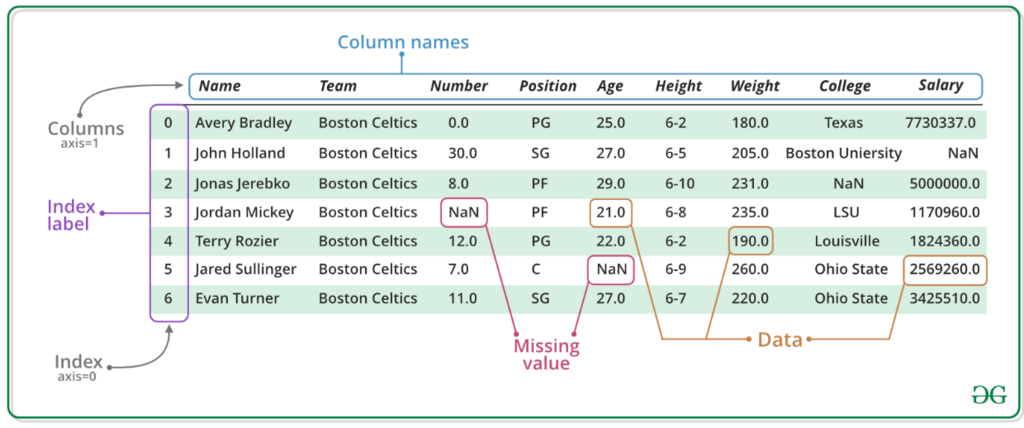
A Series is like a single column of data, while a DataFrame is a full table with rows and columns, much like a spreadsheet. You can think of a DataFrame as a collection of Series objects that share the same index.
Here’s how you can create a simple DataFrame from a dictionary.
import pandas as pd

data = {
    'Name': ['Alice', 'Bob', 'Charlie'],
    'Age': [25, 30, 28],
    'City': ['New York', 'Los Angeles', 'Chicago']
}

df = pd.DataFrame(data)

print(df)
Pandas makes it easy to select, filter, and manipulate data. For example, finding everyone older than 27 is a one-liner.
# Select rows where Age is greater than 27
older_people = df[df['Age'] > 27]

print(older_people)
Pandas is the workhorse for data cleaning and preparation, often called "data wrangling." Most data scientists spend a significant amount of time just getting their data into a usable format, and Pandas is the primary tool for that job.
Matplotlib for Visualization
Once your data is clean and organized, you need to understand it. Visualizations are one of the most powerful ways to spot trends, outliers, and patterns. Matplotlib is the original, and still one of the most widely used, plotting libraries in Python.
With Matplotlib, you can create all sorts of plots, from simple line graphs to complex scatter plots and histograms. Let's create a basic bar chart using our DataFrame from before.
import matplotlib.pyplot as plt

# Create a bar chart of names and ages
plt.bar(df['Name'], df['Age'])

# Add labels and a title
plt.xlabel('Name')
plt.ylabel('Age')
plt.title('Ages of Individuals')

# Display the plot
plt.show()
This code generates a simple bar chart showing the age of each person. Matplotlib is highly customizable, allowing you to control nearly every aspect of your plot, from colors and line styles to axis labels and titles.
Which Python library is primarily used for organizing and manipulating tabular data, similar to a spreadsheet?
The core data structure in the NumPy library is the ____.
Together, these three libraries provide a robust foundation for nearly any data analysis task in Python. Mastering them is a key step in becoming a proficient data scientist.