Professional SPSS Data Analysis
Data Management Workflows
From Raw Data to Ready Data
Raw data is rarely ready for analysis. It’s often messy, poorly labeled, and structured in a way that’s inconvenient for the questions you want to answer. A data management workflow is your plan for transforming this raw material into a clean, analysis-ready dataset. It's the essential, non-glamorous work that makes sophisticated analysis possible.
Think of it as preparing ingredients before you start cooking. You wouldn’t throw whole, unwashed vegetables into a pot. You wash, chop, and organize them first. Similarly, we must prepare our data before we can extract meaningful insights from it.
Labeling and Transforming Variables
The first step toward clarity is labeling. SPSS allows you to assign two types of labels:
- Variable Labels: A descriptive name for a variable (e.g., giving the variable
Q1_expthe label "Experience with Product"). This is crucial because cryptic variable names likeQ1_expare easy to forget. - Value Labels: Descriptions for the numbers used in categorical variables. For a 'gender' variable, you would assign the label "Male" to the value 1 and "Female" to the value 2. Without these, your output would just show 1s and 2s, forcing you to constantly look up what they mean.
Proper labeling makes your dataset understandable to colleagues and to your future self.
Clear labels turn cryptic data into a coherent story.
Once data is clearly labeled, you can start transforming it. A common task is recoding, where you change a variable's values. For instance, you might want to group a continuous 'age' variable into categories. The best practice is to always use Recode into Different Variables. This creates a new variable for your recoded values, preserving the original data. If you make a mistake, you can simply delete the new variable and start over without having lost your raw data.
Beyond recoding, you'll often need to compute entirely new variables from existing ones. Imagine you have data from a 5-item satisfaction survey, with each item rated 1-7. You can compute a new variable, Total_Satisfaction, by summing the scores from all five items. SPSS includes a variety of built-in functions, from simple arithmetic to statistical functions like MEAN() or SD().
You can add powerful complexity using conditional logic. By using IF statements in the Compute Variable command, you can create a variable based on specific criteria. For example, you could create a new binary variable called High_Income that gets a value of 1 if a person's reported income is over $75,000 and 0 otherwise. This is how you translate theoretical cohorts into concrete variables for analysis.
Reshaping Your Dataset
Your research might require combining data from different sources. SPSS offers two primary ways to do this: merging and appending.
Merging files adds new variables (columns) to your dataset. You do this when you have different information for the same set of cases. For example, you might have one file with student demographic data and another with their test scores. By merging them on a common student_ID variable, you can combine both sets of information into a single, comprehensive file.
Appending files adds new cases (rows) to your dataset. This is used when you have the same variables for different sets of cases. For instance, if you collected survey data in two different cities and have two separate files, you can append them to create one large dataset for analysis. For this to work, the variables in both files must be identical in name and type.
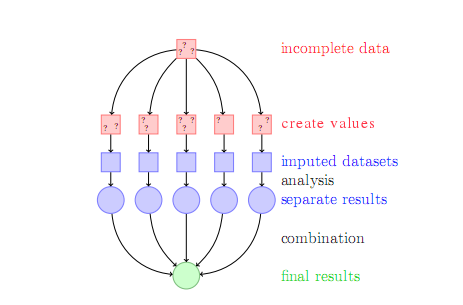
Missing data is an unavoidable reality in research. People skip questions, equipment fails, or data entry errors occur. How you handle it is critical. SPSS uses a system-missing value (represented by a period) to denote empty cells. You can also define user-missing values to specify why data is missing. For example, in a survey, you could code 98 as "Refused to Answer" and 99 as "Don't Know." Defining these tells SPSS to exclude them from calculations, which is crucial for maintaining the integrity of your results.
Sometimes your data isn't in the right shape for a specific analysis. Data is often organized in either a wide or long format.
- Wide format: Each row represents a unique subject (e.g., a person), and repeated measurements are in separate columns (e.g.,
weight_month1,weight_month2,weight_month3). - Long format: Each row represents a single observation. A subject will have multiple rows, one for each measurement. There would be a
subject_IDcolumn, amonthcolumn, and aweightcolumn.
Certain analyses, like repeated measures ANOVA, require data to be in one format or the other. The Data Restructuring Wizard in SPSS is a powerful tool that lets you switch between these formats without manual, error-prone copying and pasting.
| Format | Description | Use Case Example |
|---|---|---|
| Wide | One row per subject. Repeated measures in separate columns. | Viewing a patient's entire history at a glance. |
| Long | Multiple rows per subject. One row per observation time. | Running a mixed-effects model to analyze growth over time. |
Filtering and Focusing
Not all analyses involve your entire dataset. Often, you'll want to focus on a specific subgroup. SPSS provides two key tools for this: Select Cases and Split File.
Select Cases lets you filter your dataset to temporarily analyze a subset of your data. For example, you could select only the female participants, or only participants over the age of 40. SPSS gives you the option to either filter out the unselected cases (hiding them from analysis) or delete them entirely. Filtering is almost always the safer choice.
Split File doesn't filter data; it organizes your output. This command allows you to run the same analysis simultaneously for different groups. For instance, you could use Split File on a 'region' variable. Then, if you run a descriptive statistics command, SPSS will produce separate output tables for each region. This is incredibly efficient for comparing groups.
Data cleaning and preprocessing are perhaps the most time-consuming tasks in data analysis but are crucial for delivering accurate results.
By mastering these data management workflows, you build a solid and reliable foundation. This careful preparation ensures that when you finally run your statistical tests, the results you get are accurate, trustworthy, and ready for interpretation.
In SPSS, you have a variable named gender where 1 represents "Male" and 2 represents "Female". What feature would you use to assign the text "Male" and "Female" to the numbers 1 and 2?
When you need to group a continuous variable like age into categories (e.g., 18-25, 26-35), the recommended best practice in SPSS is to use "Recode into Same Variables" to save space.