Professional MEP Quantity Surveying
Technical Drawing Interpretation
Decoding MEP Drawings
Architectural drawings give us the 'what' and 'where' of a building, but MEP (Mechanical, Electrical, and Plumbing) drawings show us how it works. For a quantity surveyor, these plans are the key to accurately costing a project. They move beyond the basic layout to detail the complex systems that bring a building to life.
Instead of just walls and windows, you'll find symbols for air handling units, electrical circuits, and pipework. Understanding these technical schematics is about translating a flat, 2D drawing into a functional, 3D system. The first step is learning the language of these drawings: symbols.
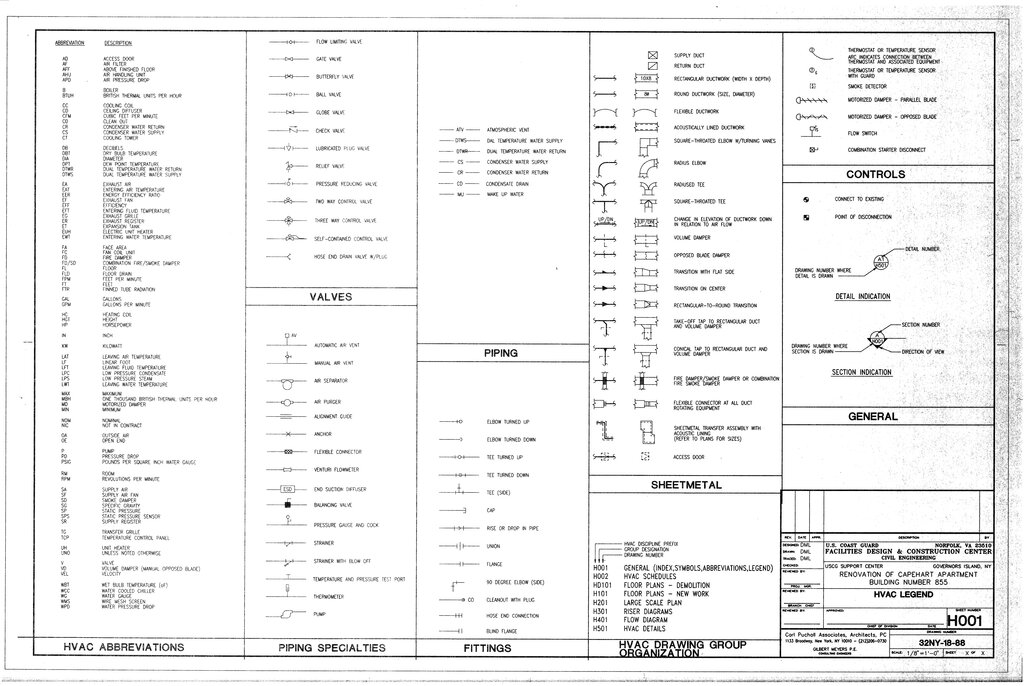
Every set of MEP drawings includes a legend or symbol list, usually on one of the first pages. This is your dictionary. It defines every symbol, line type, and abbreviation used in that specific set of plans. Never assume a symbol means the same thing from one project to the next; always refer to the legend provided.
For example, a circle might represent a light fixture, but the type of light (e.g., recessed, emergency, pendant) will be indicated by small variations or accompanying letters. Similarly, different line styles distinguish between hot water supply, cold water return, or drainage pipes. Committing common symbols to memory is useful, but the legend is the ultimate source of truth for any given project.
Beyond individual symbols, you need to understand different types of drawings and what they represent.
Diagrams, Layouts, and Schematics
MEP information is presented in several ways. Single-line diagrams, riser diagrams, and service layouts each offer a unique perspective on the system.
Electrical Riser Diagrams are like a building's family tree for power. They show how electricity flows from the main supply down to individual distribution boards and final circuits on each floor. They are not drawn to scale and don't show the physical location of components, but they are essential for understanding the electrical hierarchy and capacity. From a quantity surveying perspective, this diagram helps you count major components like switchgear and distribution boards and estimate the total length of main cables.
Plumbing Service Layouts, on the other hand, are plan views overlaid on the architectural floor plan. They show the exact routes of pipes for hot and cold water, drainage, and gas. Here, you can measure pipe lengths accurately, count fittings like elbows and tees, and identify the location of every fixture, from sinks to floor drains.
HVAC Ductwork Schematics are similar. They are plan views showing the layout of supply and extract ductwork, along with equipment like Air Handling Units (AHUs) and Fan Coil Units (FCUs). These drawings are crucial for quantifying the amount of ductwork (in square metres), insulation, and the number of grilles, diffusers, and dampers.
A riser diagram shows the 'what' and 'how connected'. A layout plan shows the 'where'.
Coordination and Specifications
In a complex building, pipes, ducts, and electrical trays all compete for the same limited space in ceilings and walls. Coordination Drawings are used to manage this. These are composite plans showing all MEP services overlaid together, often along with structural elements. Their main purpose is to identify and resolve 'clashes' – instances where two services are designed to occupy the same space.
For a quantity surveyor, reviewing coordination drawings can reveal changes from the individual layouts. A pipe might need to be re-routed, adding extra length and fittings. Detecting these clashes early is key to avoiding costly changes during construction.
Mechanical, Electrical, and Plumbing (MEP) design is a critical aspect of any building project, ensuring that the essential services within the structure function efficiently and effectively.
Finally, the drawings tell you the quantity and location, but the Equipment Schedules and Specifications tell you the quality and type. A schedule is a table on the drawing that lists all the items of a certain type, like light fixtures, radiators, or distribution boards. It provides a unique reference number for each, along with key technical data.
For example, a Lighting Schedule would list each light fitting type (e.g., 'L1', 'L2'), and for each, it would specify the manufacturer, model number, power rating, and lamp type. A Pipe Schedule would detail the material (e.g., copper, uPVC), diameter, and insulation type for different services. This information is absolutely vital. You aren't just counting '10 radiators'; you're counting '10 Stelrad Compact K2 600x1200 radiators'. The cost difference is significant, and this detail is what separates an estimate from an accurate quotation.
| Drawing Type | Purpose | QS Focus |
|---|---|---|
| Riser Diagram | Shows system hierarchy & flow | Counting major equipment, main cable/pipe runs |
| Service Layout | Shows exact location & route | Measuring lengths, counting fittings & fixtures |
| Coordination Drawing | Identifies clashes between services | Noting deviations, extra fittings from re-routing |
| Schedules | Provides technical details | Defining material, size, model for accurate pricing |
With a handle on these documents, you can start building a comprehensive picture of the MEP systems.
What is the primary purpose of a symbol legend on a set of MEP drawings?
A quantity surveyor needs to count the number of main distribution boards and understand how power is distributed from the main supply to each floor. Which drawing is best suited for this task?
Interpreting these drawings correctly is the foundation of all MEP quantity surveying. By combining information from legends, layouts, risers, and schedules, you can translate complex designs into a detailed and accurate list of materials and equipment.