Professional Data Analysis with Pandas
DataFrame Core Concepts
From Spreadsheets to DataFrames
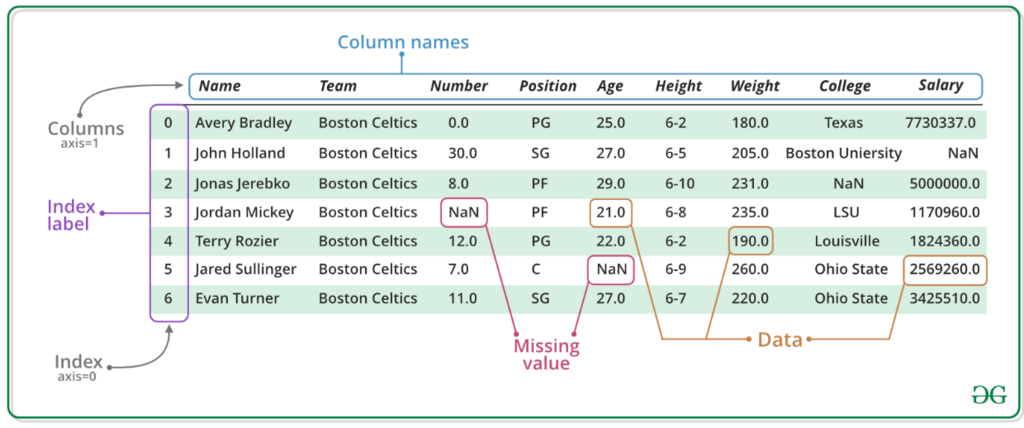
If you've worked with data in Excel or Power BI, you're used to thinking in terms of cells and tables. A Pandas DataFrame is similar—it's a two-dimensional table with rows and columns. But the way you interact with it is fundamentally different.
Instead of clicking on individual cells or applying filters through a user interface, you manipulate the data programmatically. A spreadsheet uses cell-based logic, where a formula in one cell can reference another. A DataFrame uses column-oriented logic. You typically apply an operation to an entire column at once, which is incredibly efficient for large datasets.
Loading Your Data
The first step in any analysis is getting your data into a DataFrame. Pandas makes it simple to load data from common formats like CSV and Excel files. The library handles the parsing, so you can quickly get a structured table to work with.
For a CSV (Comma-Separated Values) file, you'll use the read_csv function.
import pandas as pd

# Load data from a CSV file
df_csv = pd.read_csv('your_data.csv')
Loading an Excel file is just as straightforward using the read_excel function. You can even specify which sheet to load if the file has multiple.
# Load data from an Excel file
# This loads the first sheet by default
df_excel = pd.read_excel('your_spreadsheet.xlsx')

# Or, load a specific sheet by name
df_specific_sheet = pd.read_excel('your_spreadsheet.xlsx', sheet_name='SalesData')
Finding Data Programmatically
In Excel, you might use VLOOKUP to find a value in one column and return a corresponding value from another. In Pandas, this task is handled by index-based selection, primarily using .loc.
The .loc accessor lets you select data by its row and column labels. It's like giving Pandas the row's name and the column's name to find a specific piece of data. First, you often need to set one of your columns as the index, which acts as the unique label for each row.
# Assume df has columns 'ProductID', 'ProductName', 'Price'
# Set 'ProductID' as the index for easy lookups
df = df.set_index('ProductID')

# Find the price of the product with ID 'XZ-103'
# This is like VLOOKUP('XZ-103', ..., return 'Price' column)
price = df.loc['XZ-103', 'Price']

print(price)
There is also .iloc, which selects data by its integer position (row number and column number) instead of its label. This is useful when you know the exact position of the data you want.
.locuses labels..ilocuses integer positions. This distinction is a core concept for selecting data in Pandas.
Filtering with Conditions
Filtering data in a spreadsheet usually involves clicking a dropdown menu on a column header and checking boxes. Pandas achieves the same result with a more powerful and repeatable method: boolean indexing.
You write a condition that evaluates to True or False for each row. For example, df['Price'] > 100 produces a Series of True and False values. When you pass this Series back into the DataFrame, Pandas returns only the rows where the value was True.
# Sample DataFrame of products
data = {'ProductName': ['Laptop', 'Mouse', 'Keyboard', 'Monitor'],
        'Price': [1200, 25, 75, 300],
        'Category': ['Electronics', 'Electronics', 'Electronics', 'Electronics']}
df = pd.DataFrame(data)

# Find all products where the price is greater than $100
high_price_products = df[df['Price'] > 100]

print(high_price_products)
This method is not only fast but also self-documenting. Anyone reading your code can see the exact logic used to filter the data, which isn't possible with a few clicks in a GUI. You can also combine multiple conditions using & (and) and | (or).
# Filter for products that are over $100 AND are in the 'Electronics' category
# Note the parentheses around each condition
expensive_electronics = df[(df['Price'] > 100) & (df['Category'] == 'Electronics')]

print(expensive_electronics)
Series and DataFrames
It's helpful to understand the two core data structures in Pandas: the DataFrame and the Series. The distinction is simple:
- A DataFrame is the entire table, a 2D structure with rows and columns.
- A Series is a single column from that table, a 1D array-like object.
When you select a single column from a DataFrame, like df['Price'], the object you get back is a Series. Think of a DataFrame as a dictionary of Series objects, where each Series is a column and they all share the same index (the row labels).
Understanding this relationship is key. Many operations in Pandas are methods that can be applied to either a Series or a DataFrame. Knowing which object you're working with helps you choose the right function and predict the result.
What is the fundamental difference between the logic used by a Pandas DataFrame and a traditional spreadsheet like Excel?
Which function is used to load data from a Comma-Separated Values file into a Pandas DataFrame?
This shift from a GUI to a programmatic approach is the biggest leap when moving to Pandas. But once you're comfortable with it, you'll find that code is far more powerful, scalable, and reproducible than manual clicks.