Predicting Copa del Rey Match Outcomes
Introduction to Match Analysis
Beyond the Score
A 2-1 victory looks straightforward on paper, but the final score only tells a fraction of the story. Match analysis is the art of looking deeper, of understanding the countless small events that lead to a win, loss, or draw. It's about breaking down the 90 minutes to see how a team's strategy worked, where individual players shined, and what factors tilted the game one way or another.
Think of it like being a detective. The final score is the outcome of the case, but your job is to gather clues from the game itself to explain exactly how it happened. This process helps coaches refine tactics, scouts identify talent, and fans appreciate the beautiful game on a whole new level.
The Team as a System
No player acts alone. A football team is a complex system where every individual's actions affect the whole. A key part of analysis is understanding team dynamics, which starts with the formation. Whether a team lines up in a classic 4-4-2, a modern 4-3-3, or a defensive 5-3-2, the formation sets the basic structure for how they will attack and defend.
Beyond the shape, there's the style of play. Is a team focused on keeping the ball, patiently building attacks through short passes? This is a possession-based style. Or do they prefer to sit back, absorb pressure, and launch fast, direct attacks when they win the ball back? That's a counter-attacking approach. The chemistry and communication between players are the invisible threads that hold these strategies together. A perfectly timed run from a forward is useless if the midfielder doesn't see it and deliver the pass.
Measuring What Matters
To understand the game, we need to measure it. Player performance metrics are the fundamental building blocks of match analysis. Some are obvious: goals, assists, and for goalkeepers, saves. These are the headline stats that often decide matches. But the story doesn't end there.
Beneath the surface are stats that reveal a player's contribution to the team's overall strategy. How often does a midfielder complete their passes? A high pass completion percentage suggests reliability and control. How many tackles does a defender win? This points to their defensive strength. Even the distance a player covers can indicate their work rate and fitness. These metrics help paint a complete picture of a player's performance beyond just the highlight moments.
| Metric | What It Measures | Why It's Important |
|---|---|---|
| Pass Completion % | The ratio of successful passes to total attempted passes. | Indicates a player's accuracy and ability to maintain possession. |
| Tackles Won | The number of times a player takes the ball from an opponent. | A key indicator of defensive skill and effectiveness. |
| Shots on Target | The number of shots that would have gone into the goal if not for the keeper. | Measures a player's shooting accuracy and goal-scoring threat. |
| Distance Covered | The total distance a player runs during a match. | Shows a player's work rate, fitness, and involvement in the game. |
It's also important to consider factors outside the players' control. External conditions can have a huge impact on a match. A rain-soaked pitch can make the ball skip unpredictably and cause players to slip, favoring a more direct, physical style of play over intricate passing. Extreme heat can lead to faster fatigue, while strong winds can alter the flight of a long pass or shot. Even the home-field advantage, with a supportive crowd, can provide a significant psychological boost.
A muddy pitch and a roaring home crowd can be the great equalizers, turning a technically superior team's advantage into a grueling battle of will.
Gathering the Data
So where does all this information come from? Data collection has evolved dramatically. Traditionally, it relied on the keen eyes of scouts and coaches, who would manually record events with a pen and paper while watching from the stands.
Today, technology plays the leading role. Every top-level match is filmed by multiple cameras, allowing analysts to review every play from various angles. This video analysis is often supplemented by advanced tracking systems. Players might wear GPS vests that monitor their physical output, from their top speed to the number of sprints they make. Specialized optical tracking cameras installed in stadiums can map the position of every player and the ball 25 times per second.
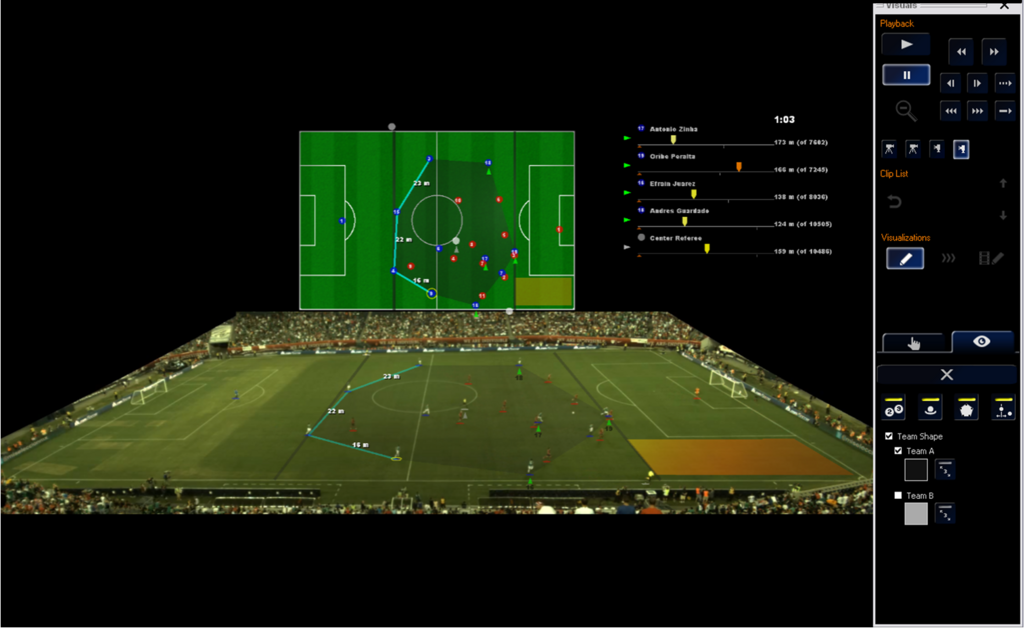
This flood of data is then organized and analyzed. Basic statistical analysis helps analysts spot patterns. For example, they might see that a team creates most of its chances from the left side of the field or that a specific player is most effective in the final 20 minutes of a game. This isn't about predicting the future with complex algorithms; it's about using concrete data to understand what happened and why. By carefully studying team dynamics, player metrics, and the conditions of the game, analysts can build a rich, detailed story that goes far beyond the final score.