Predicting Amazon's Stock Performance
Data Acquisition
Where to Find Financial Data
Before analyzing any company, you need reliable data. The quality of your analysis depends entirely on the quality of your inputs. For publicly traded companies like Amazon, the primary source is always their official filings with the U.S. Securities and Exchange Commission (SEC). These are public records, available to everyone through the SEC's EDGAR database.
The two most important filings are the Form 10-K (an annual, audited report) and the Form 10-Q (a quarterly, unaudited report). These documents contain the company's financial statements and management's discussion of the results.
While SEC filings are the gold standard for accuracy, they can be dense. Financial data providers like Yahoo Finance, Bloomberg, and Reuters aggregate this information into a more user-friendly format. These platforms are excellent for quickly accessing historical data and key metrics, but it's a good practice to cross-reference their numbers with the original 10-K or 10-Q, especially if a number seems unusual.
The Core Financial Statements
Financial analysis rests on three key documents. Together, they provide a comprehensive view of a company's financial health. Think of them as different lenses for looking at the same business.
Income Statement
noun
Shows a company's financial performance over a specific period, like a quarter or a year. It starts with revenue, subtracts costs and expenses, and ends with net income (or profit). It answers the question: Is the company profitable?
Next is the balance sheet. Unlike the income statement, which covers a period of time, the balance sheet is a snapshot at a single point in time. It shows what a company owns (assets) and what it owes (liabilities). The difference between them is the shareholders' equity.
Finally, the cash flow statement tracks the actual cash moving in and out of the company. Profit on an income statement isn't the same as cash in the bank. This statement breaks cash movement into three categories: operating, investing, and financing activities. It reveals how a company is generating and using its cash, answering the question: Where is the money coming from and where is it going?
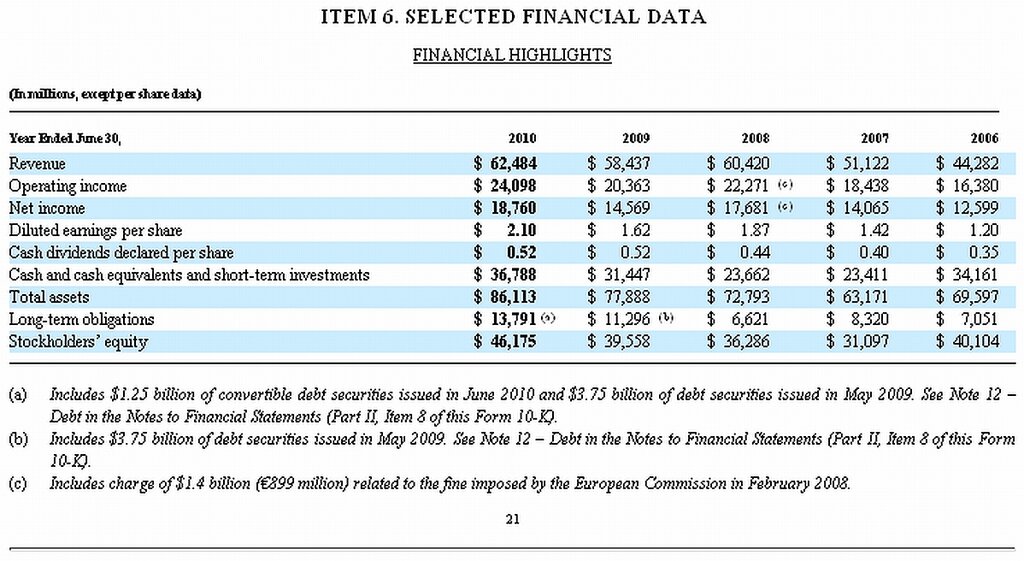
Gathering and Cleaning Data
Once you know what data you need and where to find it, you have to collect it. For analyzing a single company, you can manually enter the numbers from a financial website or a 10-K into a spreadsheet. This is straightforward and helps you get familiar with the statements.
For more systematic or large-scale analysis, you'd use an Application Programming Interface (API). An API allows a program to request data directly from a financial provider's servers. Instead of visiting a website, your code sends a request and gets clean, structured data back. This is how investment firms and analysts gather vast amounts of data efficiently.
# This is a simplified, hypothetical example
# of what an API call might look like in Python

import financial_data_api

# Set your API key for authentication
api_key = "YOUR_API_KEY"

# Request Amazon's income statement data
amzn_income_statement = financial_data_api.get(
    ticker="AMZN",
    statement="income_statement",
    period="quarterly",
    api_key=api_key
)

print(amzn_income_statement)
Raw data is rarely perfect. After collection, you need to clean and organize it. This is a critical step that ensures your analysis is accurate.
- Check for Consistency: Ensure the time periods align. If you're comparing quarterly data, make sure you have every quarter. Financial years can also differ between companies.
- Handle Missing Values: Sometimes a data point is missing. You might need to leave it blank, estimate it based on a trend, or find it from another source.
- Standardize Units: Are the numbers in thousands, millions, or billions? Make sure all your data uses the same scale. Financial statements usually specify this at the top of the table.
- Watch for Restatements: Companies sometimes revise previous financial statements. Always try to use the most up-to-date data for historical periods.
Organizing your data logically in a spreadsheet, with clear labels for each line item and time period, creates a solid foundation for the analysis to come.
What is the most reliable and primary source of financial data for a publicly traded U.S. company?
Which financial statement is described as a 'snapshot' of a company's financial position at a single point in time?
With clean, organized data from reliable sources, you're ready to start digging into the numbers.