Precision Forest Carbon Mapping
Multi-Sensor Data Acquisition
Building a Complete Picture
Accurately estimating forest carbon isn't a job for a single satellite. Each sensor has its strengths and blind spots. Optical sensors struggle with clouds, while radar can see through them but has its own complexities. To get a reliable result, we need to combine, or fuse, data from multiple sources. This strategy uses different sensors to cross-validate and enrich our understanding.
We'll focus on three key types of data: optical imagery from Sentinel-2, Synthetic Aperture Radar (SAR) from Sentinel-1, and LiDAR from the Global Ecosystem Dynamics Investigation (GEDI). Each provides a unique piece of the puzzle, and together they allow us to build a robust model of aboveground biomass.
Optical Data for Surface Detail
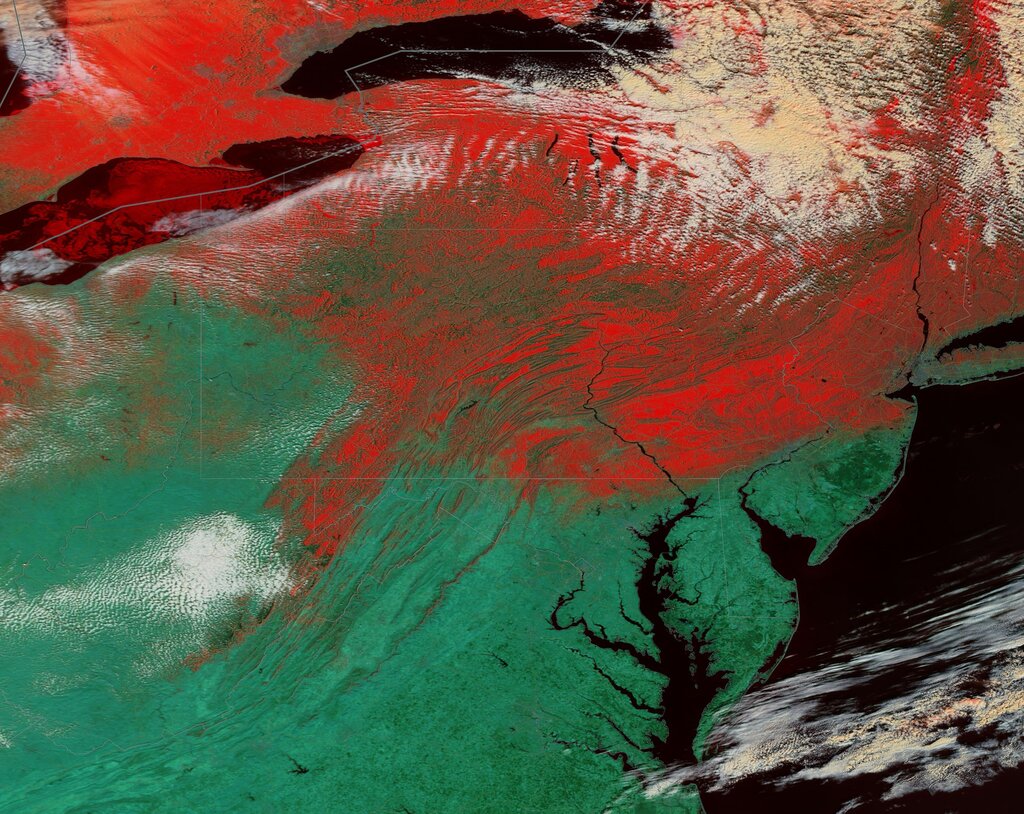
Our primary optical data source is Sentinel-2, a mission from the European Space Agency's Copernicus programme. It provides high-resolution multispectral imagery, which is excellent for classifying land cover and assessing vegetation health. We're not just downloading pretty pictures; we specifically need Level-2A products.
Level-2A data gives us surface reflectance. This means the imagery has been corrected for atmospheric effects like haze and water vapour. Without this correction, a hazy day could make a forest look less healthy than it is, throwing off our carbon estimates. Using surface reflectance ensures we're analysing what's actually on the ground, not what the atmosphere is doing.
Seeing Through Clouds with Radar
Next, we turn to Sentinel-1 for its C-band Synthetic Aperture Radar (SAR). Unlike optical sensors, SAR is an active system. It sends out a microwave pulse and measures the signal that bounces back, known as backscatter
This is invaluable because radar can penetrate clouds and works day or night. We use Ground Range Detected (GRD) products, which are processed to remove geometric distortions. The intensity of the backscatter relates to the structural complexity of the forest—its branches, trunks, and leaves. More biomass generally means more backscatter.
However, C-band SAR has a limitation: in very dense forests, the signal becomes saturated. After a certain point, more biomass doesn't increase the backscatter signal, making it difficult to differentiate between high-biomass areas. This is a critical challenge we need to address.
The combination of optical and radar data provides a powerful synergy. Sentinel-2 tells us about the health and type of vegetation, while Sentinel-1 gives us information about its physical structure.
Calibration with LiDAR
To build an accurate model, we need reliable ground truth data for calibration. Instead of relying solely on field plots, we can use LiDAR data from space. The instrument, mounted on the International Space Station, provides exactly what we need.
GEDI fires laser pulses at the Earth and measures the returning waveform. This gives us highly accurate, 3D measurements of forest structure. We'll use the GEDI L4A product, which provides estimates of Aboveground Biomass Density (AGBD) at the footprint level (a ~25-metre circle). These high-quality estimates are our calibration 'truth'. We will use them to train our model to relate the Sentinel-1 and Sentinel-2 data to actual biomass on the ground.
The Next Generation of Forest Radar
The saturation issue with Sentinel-1's C-band highlights the need for a different kind of radar. The upcoming ESA Biomass mission, planned for a 2025 launch, is designed to solve this problem. It will carry the first spaceborne P-band SAR.
P-band uses a much longer wavelength than C-band. This allows the radar signal to penetrate deep into dense forest canopies, interacting directly with the major trunks and branches where most of the biomass is stored. This capability will dramatically reduce the saturation problem and allow for more direct and accurate biomass estimation in the world's most carbon-dense forests.
| Sensor/Mission | Data Product | Primary Role in Carbon Estimation |
|---|---|---|
| Sentinel-2 | Level-2A Surface Reflectance | Provides vegetation health and type information (optical). |
| Sentinel-1 | C-band GRD | Measures forest structure and density via backscatter (radar). |
| GEDI | L4A AGBD | Offers direct biomass measurements for model calibration (LiDAR). |
| ESA Biomass | P-band SAR | Will provide direct biomass data in dense forests, overcoming saturation. |
Harvesting the Data
With our data sources identified, the next step is acquisition. Manually downloading tiles for a large study area is impractical. Instead, we use Application Programming Interfaces (APIs) to script and automate the process.
For Sentinel-1 and Sentinel-2 data, Google Earth Engine (GEE) is an excellent platform. It provides access to the entire archive and allows for cloud-based preprocessing, saving significant time and local storage. For GEDI data, NASA's Earthdata Search portal is the primary access point, offering programmatic access to download the L4A data product.
By scripting our data acquisition, we create a reproducible workflow that can be easily updated as new imagery becomes available. The end result is a structured local repository containing all the multi-modal data required for the next stage: preprocessing and fusion.
Time to check your understanding of these key data acquisition concepts.
Why is it necessary to combine, or fuse, data from multiple satellite sources for forest carbon estimation?
What is the primary limitation of Sentinel-1's C-band SAR when measuring biomass in very dense forests?
Now that you have a clear plan for acquiring the necessary satellite data, you're ready to move on to preprocessing. This next phase will involve aligning, cleaning, and preparing each dataset so they can be effectively combined in your biomass model.