Precision and Pitfalls of GDP
Data Collection Realities
The Two Sides of the Coin
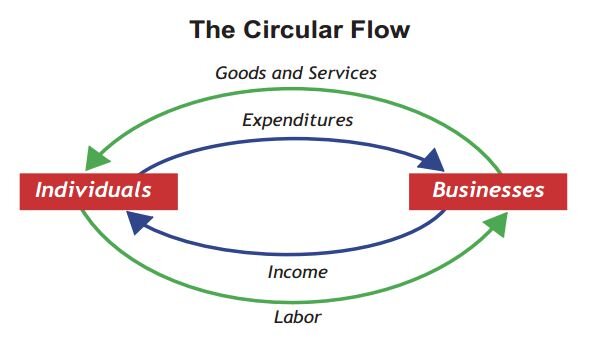
In theory, calculating a country's Gross Domestic Product (GDP) is straightforward. You can add up all the spending on final goods and services, known as the expenditure approach. Or, you can add up all the income earned from producing those goods and services, the income approach. Every dollar spent on a cup of coffee is a dollar of income for the barista, the shop owner, and the coffee bean farmer. The two sides should always match.
But reality is messy. The data for spending comes from different sources than the data for income. Spending figures are often gathered from retail sales surveys and trade data from the Census Bureau. Income figures come largely from tax records filed with the IRS and employment data. These sources don't always align perfectly due to different collection methods, timing, and reporting errors.
Mind the Gap
When the government's accountants at the (BEA) total up the two approaches, the numbers are almost never identical. The difference between the GDP calculated from the spending side and the GDP from the income side is called the statistical discrepancy. It's essentially an official acknowledgement that our measurement tools aren't perfect. The BEA treats this discrepancy as part of the income side of the ledger to ensure both totals balance.
Think of it like balancing your own checkbook. You have your bank statement (expenditures) and your pay stubs (income). If they don't perfectly reconcile at the end of the month because of a pending transaction or a small cash purchase you forgot to record, you might add a line item for 'unaccounted for' to make it balance. The statistical discrepancy serves a similar purpose in the national accounts.
The statistical discrepancy is a plug figure. It reflects the reality that the vast, complex U.S. economy can't be measured with perfect precision.
This entire process is governed by the (NIPA). These accounts are the formal accounting framework the United States uses to measure and describe its economic activity. Developed in the 1930s, the NIPA framework provides a consistent set of rules for how to define and calculate the components of GDP, ensuring that we're comparing apples to apples over time.
Avoiding Double Counting
Another major challenge is ensuring that goods aren't counted more than once as they move through the supply chain. GDP is a measure of final output. This means we only want to count the value of a finished car, not the value of the steel, tires, and glass that went into it.
If we counted the $2,000 worth of steel sold to the carmaker and then also counted the final $30,000 price of the car, we'd be counting that $2,000 of steel twice. These components are called —products used in the production of a final good. The BEA must carefully filter these out by tracking sales between businesses and focusing only on the final market value of what consumers, businesses (for investment), and the government buy.
Moving from the clean theoretical formula to a single, reliable national figure is a massive undertaking. It requires reconciling conflicting data and carefully filtering out transactions to paint an accurate picture of the economy.
What is the primary reason for the "statistical discrepancy" in national income accounting?
To avoid double-counting in GDP calculations, only the value of final goods and services is included.