Power BI Data Analysis
Advanced Data Modeling
Mastering Scalable Data Modelling
Building high-performance reports requires a solid architectural foundation, and the Star Schema methodology is the industry standard for achieving exactly that. In this chapter, we will strip away complexity to reveal how to design data models that are both efficient and lightning-fast. You will learn to navigate the trade-offs between normalised and denormalised structures while mastering essential techniques for managing one-to-many and many-to-many relationships. By the end of this journey, you will possess the expertise to construct robust semantic models that stand up to the demands of enterprise-level reporting.
The Great Database Divide
To build reports that don't lag when a user clicks a filter, we have to address a fundamental conflict in database design. This conflict exists between systems built to record every detail of a transaction and those built to answer complex questions about those transactions. At the heart of this struggle are two opposing philosophies: and Denormalisation.
Normalisation is the gold standard for transactional systems, often referred to as databases. Think of the software that runs a grocery store checkout or an online bank. These systems need to be incredibly precise. Normalisation achieves this by breaking data into the smallest possible logical units and storing each piece of information in exactly one place. If a customer changes their address, you update it in one table, and every other part of the system immediately sees the change. This prevents data anomalies and ensures total integrity.
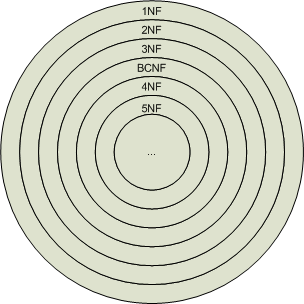
However, for reporting, a highly normalised structure is often a nightmare. To generate a simple sales report, the computer might have to search through and 'join' ten different tables. This is where Denormalisation comes in. Denormalisation is the intentional act of adding redundancy back into the model to speed up data retrieval. It is the core strategy used in Star Schemas and analytical environments.
Imagine a highly organised filing cabinet. Each drawer contains a different type of document: one for receipts, one for customer names, one for product lists. To write a report, you have to run back and forth, pulling one folder from drawer A and another from drawer B. That is a normalised database. Now, imagine a summary dashboard sitting on top of that cabinet that has already copied the most important details onto a single sheet of paper. You have the same information twice, but you can read it instantly. That is denormalisation.
A star schema trades normalization for simplicity.
The Architectural Trade Off
Choosing between these two isn't about right or wrong; it's about managing costs. In a normalised model, you save on storage space because you never store the same word twice, but you pay a high price in query complexity and slow performance. In a denormalised model, you pay for extra storage and risk (like having a customer's name spelled two different ways in different tables), but you gain incredible analytical speed.
For a data professional, the choice is usually driven by the end user. If the user is an accountant balancing books, they need the precision of a normalised model. If the user is a manager looking at sales trends over the last three years, they need the speed of a denormalised model.
| Feature | Normalised (OLTP) | Denormalised (Analytical) |
|---|---|---|
| Goal | Data Integrity | Query Speed |
| Redundancy | Minimal | High |
| Joins | Many | Few |
| Storage Cost | Lower | Higher |
| Typical Use | ATM, POS Systems | Power BI, Dashboards |
This tension between clean structure and raw speed is exactly why the Star Schema is so revered. It doesn't pick a side; instead, it finds a middle ground. By keeping the central facts in one place and the descriptive details in another, it creates a 'Goldilocks' solution: not too complex, but not too messy. In the next section, we will see exactly how this layout balances these two worlds.