Options Trading with Market Profile and TPO
Introduction to Market Profile
Seeing the Market's Structure
Most financial charts, like candlestick or bar charts, are great at telling you what happened. The price went up, then it went down. They show the path of the price over time. Market Profile asks a different question: where did the market spend its time and conduct the most business?
It’s a charting technique that organizes trading data differently to reveal the underlying structure of the market. Think of it as an X-ray of a trading session. Instead of just seeing the final score, you get to see the whole game play out, moment by moment.
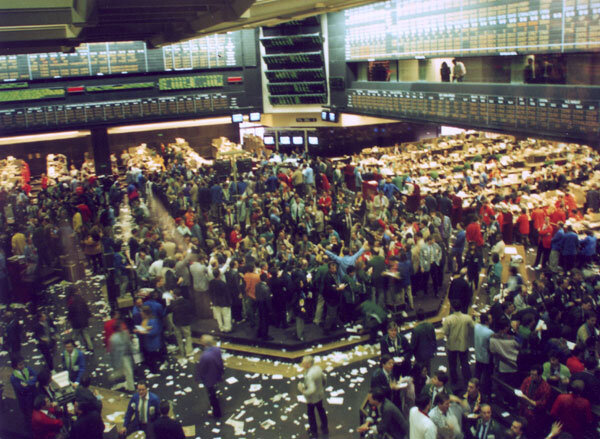
Developed by a trader named J. Peter Steidlmayer for the Chicago Board of Trade (CBOT), Market Profile was born out of a need to understand market dynamics on a deeper level. Steidlmayer saw the market as an auction process. His goal was to chart this auction to see where traders agreed on price and where they didn't.
At its core, Market Profile is not a predictive indicator or a trading system. It's a powerful analytical tool that helps you understand market behavior, identify areas of perceived value, and make more informed trading decisions.
The Building Blocks
A Market Profile chart looks like a sideways bell curve made of letters. Each part of this structure tells a specific story about the trading day. Let's break down the three most important components.
Time Price Opportunity
noun
A single letter on the chart representing a period of time the market traded at a specific price. Each letter corresponds to a time bracket, such as a 30-minute interval.
Time Price Opportunities, or TPOs, are the heart of Market Profile. A typical trading day is broken into time brackets (often 30 minutes). The first bracket is marked with the letter 'A', the second with 'B', and so on. Every time the market touches a new price during bracket 'A', an 'A' is printed at that price level. When the next time bracket begins, the chart starts printing 'B's.
This process creates a distribution of letters. Where you see a lot of different letters, the market traded at that price throughout the day. Where you see few letters, it visited only briefly.
Point of Control
noun
The price level with the longest row of TPOs, indicating the price where the most trading activity occurred during the session. It acts as a gravitational center for price.
The Point of Control (POC) is the easiest part of the profile to spot. It’s simply the price level with the most TPOs. This is the price where the market spent the most time and conducted the most business. It represents the price of greatest perceived value for that session. Think of it as the day's fairest price, where supply and demand were most in balance.
Value Area
noun
The price range where approximately 70% of the day's trading activity occurred. It highlights the zone of greatest market acceptance.
The Value Area (VA) is the price range where the bulk of trading took place. Specifically, it's the range where about 70% of the session's TPOs are located, centered around the POC. This area represents the price zone that the market accepted as fair value for the day. Prices outside this area, above the Value Area High (VAH) or below the Value Area Low (VAL), are considered to have been rejected by the market.
Reading the Profile
Putting it all together, the shape of the Market Profile tells a story. A well-formed, bell-shaped distribution indicates a balanced market where buyers and sellers are in general agreement. This is often seen on quiet trading days.
Conversely, a long, stretched-out profile suggests a trending market where price is actively searching for value. A profile with two distinct peaks (a 'b-shape' or 'p-shape') might indicate that the market found two different areas of value during the day, perhaps due to a news event.
By observing these shapes and noting the locations of the POC and Value Area, traders can gain insight into the market's conviction. Is the market accepting higher prices? Is it rejecting lower prices? Market Profile helps answer these questions by showing you where the auction is taking place.
The profile's shape reveals the market's sentiment. A wide, balanced profile shows consensus. A narrow, elongated profile shows a market in search of value.
Before we test your knowledge, let's review the key terms from this section.
Ready? Let's see what you've learned.
What fundamental question does Market Profile analysis primarily seek to answer?
In a Market Profile chart, what do the letters, known as TPOs, represent?
Understanding these basic components is the first step to using Market Profile to analyze market behavior and structure.