Opening a Successful Bar
Strategy and Financials
Charting Your Financial Course
Opening a bar isn't just about crafting great drinks; it's about designing a profitable business. Your financial model is the blueprint. Instead of looking backward at past performance, you'll create forward-looking, or pro forma financial statements. These are your best-educated guesses about the future, projecting five years out to map your path to profitability.
The three core documents are the Profit and Loss (P&L) Statement, the Balance Sheet, and the Cash Flow Statement. The P&L tracks your revenue and expenses to show profitability over a period. The Balance Sheet provides a snapshot of what you own (assets) and what you owe (liabilities) at a single point in time. Finally, the Cash Flow Statement is crucial—it tracks the actual movement of cash in and out of your business, ensuring you have the money to pay your bills, regardless of what your P&L says.
| Statement | What It Asks | Key Question for a Bar Owner |
|---|---|---|
| Profit & Loss | Are we making money? | After paying for liquor, labor, and rent, is there anything left? |
| Balance Sheet | What is our net worth? | How much of our equipment do we own outright vs. finance? |
| Cash Flow | Do we have cash to operate? | Can we make payroll this month, even if sales were slow? |
Your Bar's Vital Signs
Financial statements give you the big picture, but Key Performance Indicators (KPIs) are the daily and weekly numbers that tell you if you're on track. They are the vital signs of your bar's health. For a bar, three of the most critical KPIs are Labor Cost Percentage, Occupancy Cost, and Seat Utilization Rate.
Labor Cost Percentage is your total payroll cost (including taxes and benefits) as a percentage of your total revenue. It's one of the largest and most controllable expenses. A well-run bar typically aims to keep this between 25-35% of revenue. If it creeps up, it's a sign that you're overstaffed, paying too much, or your revenue is lagging.
combines your rent (or mortgage), property taxes, and insurance. This number tells you the true cost of your physical space. A common rule of thumb in the bar and restaurant industry is to keep this cost between 5-8% of your gross revenue. If your projections show an occupancy cost of 15%, you either need to find a cheaper location or be certain your business model can generate exceptionally high revenue to compensate.
Seat Utilization Rate measures how efficiently you're using your space. If you have 50 seats and sell 100 drinks over a 4-hour peak period, you've served each seat twice. This metric is vital for understanding your revenue potential. A craft cocktail bar might have lower utilization but a much higher average check, while a dive bar thrives on turning seats over quickly.
Find Your Financial Fit
Not all bars are created equal, and your business model will dictate your financial strategy. The trade-offs between different concepts are significant.
A craft cocktail lounge operates on high margins per drink but requires highly skilled (and more expensive) bartenders. Service is slower, which lowers seat turnover. Your inventory is complex and costly. Success here depends on creating a premium experience that justifies a $18 cocktail.
A dive bar is the opposite. It's a high-volume, low-margin game. Labor costs are lower, and service is fast. You make money on quantity, selling lots of beers and simple mixed drinks. The key is high turnover and keeping operational costs चट्टान के नीचे (rock-bottom).
A wine bar often falls somewhere in between. It can command good margins, but success hinges on smart inventory management to avoid spoilage and tying up too much cash in expensive bottles that don't sell.
| Bar Model | Margin per Drink | Labor Cost % | Seat Turnover | Key to Success |
|---|---|---|---|---|
| Craft Cocktail | High | High (30-40%) | Low | Premium experience, skilled staff |
| Dive Bar | Low | Low (20-25%) | High | High volume, low overhead |
| Wine Bar | Medium-High | Medium (25-35%) | Medium | Smart inventory, knowledgeable staff |
Your choice of model directly impacts your 5-year pro forma. A craft lounge will show higher revenue per customer but also higher cost of goods sold (COGS) and labor expenses. A dive bar's P&L will show lower gross margins but potentially higher net profit due to lower operating costs.
Planning for Uncertainty
Your financial projections are just a plan. Reality will be different. This is where comes in. It's the process of changing key assumptions in your model to see how it affects your bottom line. What happens to your break-even point if your sales are 20% lower than expected? What if your liquor costs increase by 10%?
By creating best-case, worst-case, and most-likely scenarios, you can understand the risks and prepare for them. This analysis shows you which variables have the biggest impact on your profitability. For many bars, a small dip in customer traffic can have a much larger impact than a rise in utility costs. Knowing this helps you focus on what matters most: getting and keeping customers.
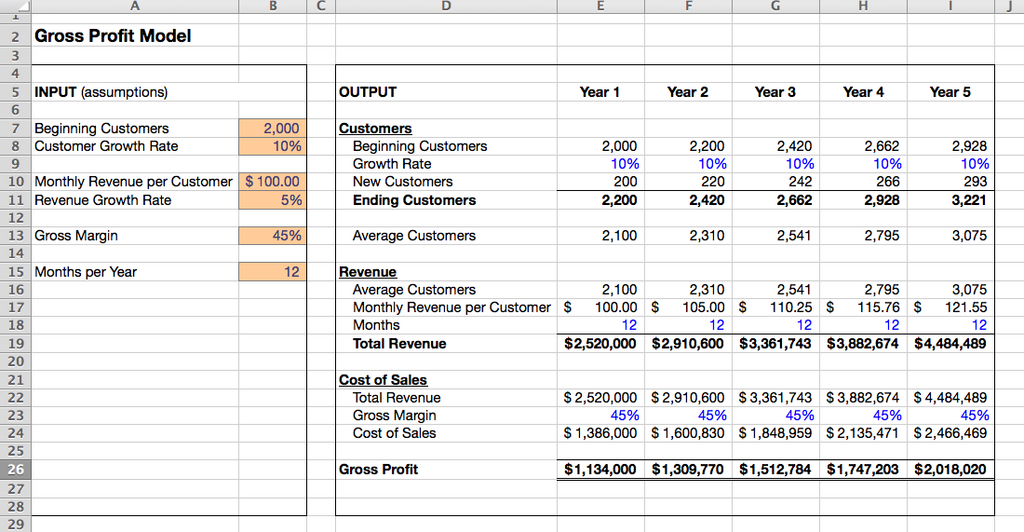
Running these scenarios helps you determine your break-even point—the level of sales at which your costs are covered and you are neither making nor losing money. Knowing this number is not just an academic exercise; it's your primary financial target in the early days. It tells you exactly what you need to achieve each night just to keep the lights on.
What are the forward-looking financial statements created to project a new bar's future performance called?
A prospective bar owner's financial model shows a projected Occupancy Cost of 15% of gross revenue. According to industry rules of thumb, what does this high percentage most strongly suggest?
Building a solid financial plan is the single most important step in turning your dream of opening a bar into a sustainable reality. It provides the roadmap, the warning signs, and the confidence to make smart decisions under pressure.