Navigating Health Information
Understanding Health Statistics
Making Sense of Health Numbers
We're constantly surrounded by numbers about our health. News reports talk about disease outbreaks, public service announcements cite risks, and fitness apps track our every step. But what do these numbers really mean? Understanding health statistics is the key to sorting through the noise and making informed decisions about personal and community well-being.
Biostatistics is founded on several key statistical principles and methodologies that ensure the accuracy, reliability, and applicability of health data analysis.
At its core, health statistics is the practice of collecting, analyzing, and interpreting data related to health. This isn't just about counting hospital beds; it's about spotting trends, understanding risks, and measuring the success of treatments and policies. Let's break down the most common types of data you'll encounter.
Counting Cases: Incidence vs. Prevalence
Two of the most fundamental concepts in health statistics are incidence and prevalence. They might sound similar, but they measure very different things. Think of them as two different ways to take a snapshot of a disease in a population.
Incidence measures the rate of new cases. It tells us how quickly a disease is spreading. Imagine a bucket of water. Incidence is like measuring how fast the faucet is dripping new water into it.
Incidence
noun
The number of new cases of a disease or health condition that appear in a population over a specific period of time.
The calculation for the incidence rate helps us compare the risk between different groups or over different times.
Prevalence, on the other hand, measures the total number of cases, both new and existing, at a specific point in time. It gives us a snapshot of how widespread a condition is. In our bucket analogy, prevalence is the total amount of water in the bucket at that moment, including both new drips and water that was already there.
Prevalence
noun
The total number of individuals in a population who have a disease or health condition at a specific time.
Prevalence is calculated as a proportion.
Imagine a town of 10,000 people. Over one year, 200 people are newly diagnosed with diabetes. The annual incidence is 200 cases. If, on December 31st, a total of 800 people in the town are living with diabetes (including the new cases), the prevalence on that day is 800.
Where Does the Data Come From?
Health statistics aren't just pulled from thin air. They come from a variety of carefully managed sources. The method of collection depends on what information is needed.
Surveys are a common tool. Organizations like the Centers for Disease Control and Prevention (CDC) conduct large-scale national surveys where they ask people directly about their health behaviors, conditions, and access to care. These provide valuable insights into trends we couldn't see otherwise.
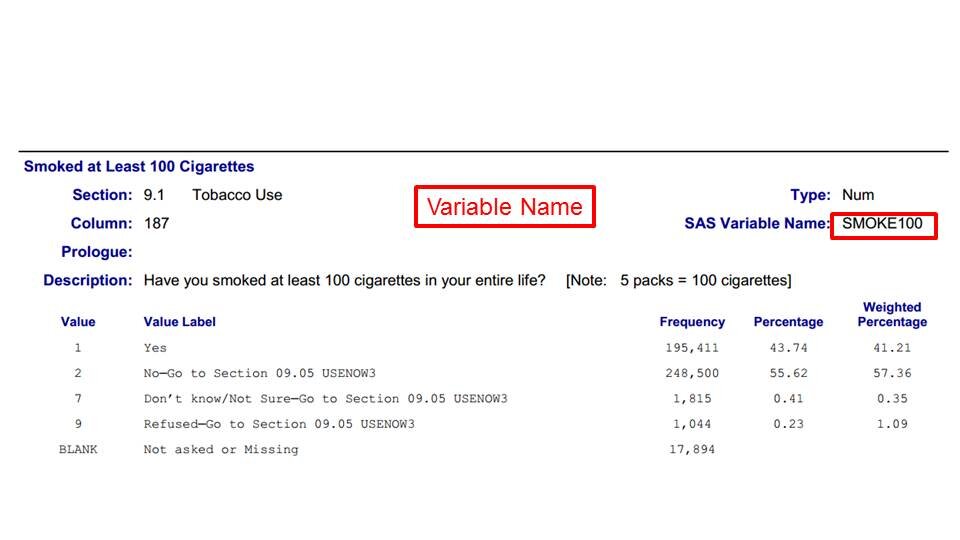
Vital Records are another key source. These are official records of major life events, including births (natality) and deaths (mortality). Death certificates, for example, list the cause of death, which is critical for tracking diseases and injuries.
Registries are specialized databases that track people with specific conditions, like cancer registries. They collect detailed information about cases to help researchers understand the disease and evaluate treatment outcomes.
Administrative Data from hospitals and insurance companies provides a wealth of information. Every hospital visit, diagnosis, and prescription generates data that can be used to understand healthcare utilization and costs.
Each data source has its own strengths and limitations. Surveys rely on people's memory and honesty, while administrative data might not capture the full picture of a person's health.
Why It Matters
So, why go to all this trouble? Accurate health statistics are the foundation of public health. They allow us to move from guessing to knowing.
With good data, public health officials can identify which communities are most affected by a health problem and direct resources where they are needed most. Researchers can track whether a new vaccine is working or if a public health campaign is changing behavior. Doctors can better understand the risks their patients face, and policymakers can make evidence-based decisions about health laws and funding.
Ultimately, health statistics tell the story of a population's health. By learning to read these numbers, you can better understand your own health and the health of the world around you.
A public health report states that there were 500 new cases of diabetes diagnosed in a city of 100,000 people last year. What does this number primarily measure?
Prevalence provides a snapshot of the ________ number of cases of a disease in a population at a specific point in time.