Mean Median Mode in College Statistics
Introduction to Central Tendency
Finding the Center of Your Data
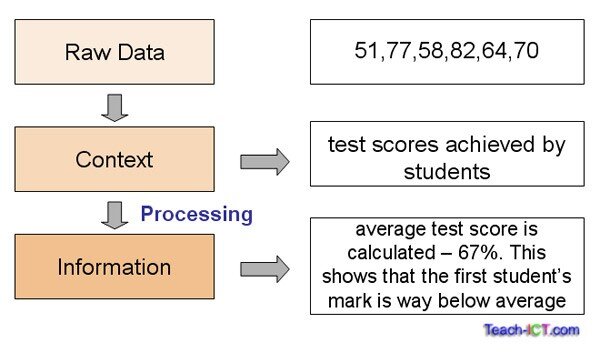
Imagine you have a long list of numbers, like the test scores for every student in a school. Looking at the entire list is overwhelming. How did the students do overall? Was it a hard test or an easy one? To answer these questions, you need a way to summarize the data.
Instead of looking at hundreds of individual scores, we can find a single, typical score that represents the whole group. This single value gives us a snapshot of the data's center.
central tendency
noun
A single value that attempts to describe a set of data by identifying the central position within that set.
Think of it as finding a balancing point. If you placed all the test scores on a seesaw, the measure of central tendency would be the point where you could place the fulcrum to make it balance. It’s a way to boil down a complex dataset into one representative number, making it much easier to understand and compare with other datasets.
Three Ways to Measure the Center
Finding the “center” isn’t always straightforward, because there’s more than one way to define it. Statistics gives us three main tools for measuring central tendency: the mean, median, and mode. Each one describes the center in a slightly different way.
The mean, median, and mode are all types of averages. Each one offers a different perspective on what's 'typical' in a set of data.
Let’s meet them one by one.
-
Mean: This is what most people think of as the “average.” You find it by adding up all the values and dividing by the number of values. It’s a very common way to find the center.
-
Median: This is the middle value. If you line up all your data points from smallest to largest, the median is the one sitting right in the middle. It’s like finding the middle person in a line of people sorted by height.
-
Mode: This is the value that appears most often in the dataset. If you're looking at shoe sizes, the mode would be the most popular size that the store sells.
| Measure | What It Is |
|---|---|
| Mean | The familiar “average” |
| Median | The middle value in a sorted list |
| Mode | The most frequent value |
Why do we need three different measures? Because sometimes one measure can be misleading. For example, if one person in a small company earns a massive salary, the mean salary might seem very high. But the median salary might give a more realistic picture of what a typical employee earns. Each measure has its own strengths, and knowing which one to use is a key skill in data analysis.
What is the primary purpose of a measure of central tendency?
A dataset contains the daily high temperatures for a week: 75, 80, 82, 82, 85, 88, 90. Which value represents the mode?
Understanding these three measures is the first step toward summarizing data and drawing meaningful conclusions from it.