Mastering Web3 Discovery and Evaluation
On-Chain Capital Flows
Following the Money
Market capitalization gives you a snapshot of a project's perceived value, but it doesn't tell you how that project is actually being used. To understand the health and momentum of a Web3 project, you need to follow the capital. Where is money flowing? Which protocols are users trusting with their assets? Which ones are generating real, sustainable revenue?
This is where on-chain analysis comes in. By looking at public blockchain data, we can get a transparent view of financial activity. The single most important tool for this job is an open and transparent data aggregator for the decentralized finance (DeFi) world. It tracks the vital signs of thousands of protocols across dozens of blockchains, giving us the raw data needed to make informed decisions.
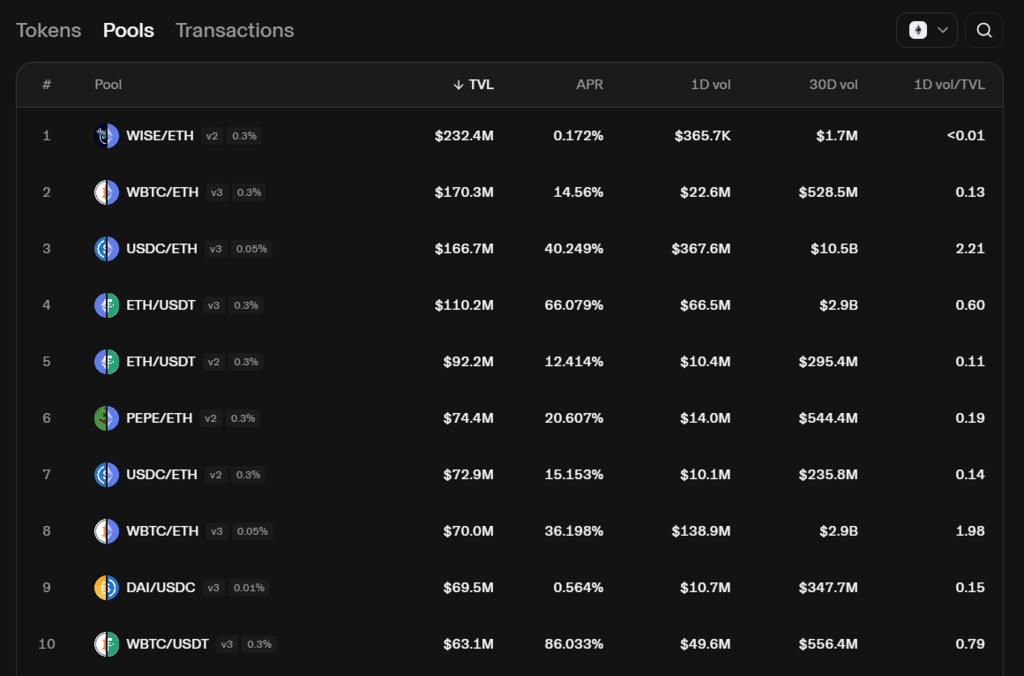
The most cited metric on the platform is Total Value Locked, or TVL. It represents the total value of all assets users have deposited into a specific protocol. Think of it as the total deposits held by a bank. A higher TVL generally signals greater trust and adoption.
The Stock vs. The Flow
While TVL is a great starting point, relying on it alone can be misleading. A more sophisticated approach is to use the "Stock vs. Flow" framework.
-
Stock: TVL is the stock of capital. It’s a snapshot of the total assets locked in a protocol at a specific moment. It represents the accumulated trust users have placed in it.
-
Flow: Protocol revenue and fees are the flow. This is the economic activity generated by the protocol. It shows how much users are willing to pay to use its services.
A protocol can have a high TVL (stock) but very low revenue (flow). This often happens with new projects that offer high token rewards to attract initial liquidity. Users deposit assets to farm these rewards, inflating the TVL, but they aren't actually using the protocol's core functions. This is called incentivized or "phantom" liquidity. Once the rewards dry up, so does the TVL.
On the other hand, sticky, organic liquidity comes from users who find genuine utility in the protocol. They are willing to pay fees to swap tokens, borrow assets, or perform other actions. A healthy protocol has a strong, consistent flow of revenue relative to its stock of TVL.
High TVL shows trust, but high revenue shows utility. A truly successful project needs both.
You can analyze this directly in DeFiLlama. The main dashboard shows TVL, but there's a dedicated tab for "Fees & Revenue." Here, you can see how much each protocol earns daily and weekly. Comparing a protocol's TVL to its revenue gives you a much clearer picture of its financial health. Is it a ghost town propped up by incentives, or a bustling digital economy?
Tracking Ecosystem Rotations
Capital doesn't just move between protocols; it moves between entire blockchains. These shifts, often called ecosystem rotations, can signal major trends in the market. A few years ago, nearly all DeFi activity was on Ethereum. Today, capital is spread across dozens of networks, including Layer 2 solutions like and and alternative Layer 1s like Solana.
DeFiLlama makes tracking these rotations simple. The "Chains" dashboard provides a leaderboard of blockchains sorted by TVL. By observing the 7-day and 1-month changes, you can spot which ecosystems are gaining momentum and which are losing steam.
A sudden influx of capital into a specific chain could be driven by the launch of a popular new application, a successful airdrop campaign, or a change in the underlying technology that makes it more attractive. Following these flows helps you stay ahead of the curve and identify where developer and user attention is heading next.
By moving beyond simple price charts and using tools like DeFiLlama to analyze the stock and flow of capital, you can begin to vet projects like a professional. You can differentiate hype from real utility, identify sustainable business models, and spot the next wave of innovation before it becomes mainstream news.
Time to test your knowledge.
In the "Stock vs. Flow" framework for analyzing DeFi protocols, what does Total Value Locked (TVL) represent?
You are analyzing a protocol on DeFiLlama and notice it has a very high TVL but generates almost no fees or revenue. What is the most likely explanation for this situation?