Mastering Vibration Spectrum Analysis
FFT Signal Processing
From Wave to Spectrum
Vibration data starts its life as a time waveform. This is a direct recording of a machine's movement over a period of time, showing the amplitude of vibration second by second. While useful, it often looks like a complex, messy jumble of signals. It's difficult to pinpoint the exact source of a problem just by looking at the raw waveform.
To make sense of the chaos, we translate the data from the time domain into the frequency domain. Instead of asking "How much is it vibrating right now?" we ask "What are all the individual frequencies that make up this vibration?" This shift in perspective is the key to diagnostics. A specific frequency might correspond to shaft imbalance, while another could signal a bearing fault or gear mesh issue. The frequency domain acts like a prism, separating the jumbled waveform into its constituent colors.
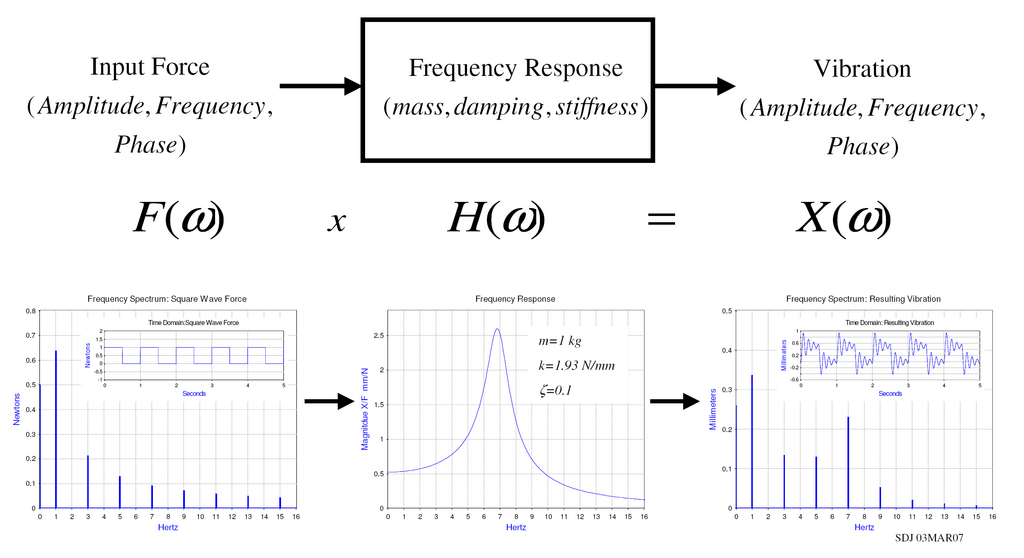
The mathematical tool that makes this translation possible is the Fast Fourier Transform, or FFT. It's an incredibly efficient algorithm that takes a chunk of time-domain data and calculates the amplitude and phase of every frequency component within it. The result is a frequency spectrum, a clear chart showing distinct peaks at the frequencies where the most vibrational energy is present. These peaks are the signatures of mechanical events.
Setting Up the Measurement
The quality of your frequency spectrum depends entirely on how you collect the data. Two critical settings are the maximum frequency () and the Lines of Resolution (LOR).
defines the upper limit of your analysis. If you suspect a high-frequency problem like a gear mesh issue, you'll need a higher . Lines of Resolution determine how detailed your spectrum is within that range. Think of it like pixels in a photograph. More lines give you a sharper, more detailed view of the frequency landscape, but require more data and a longer measurement time.
A smaller is crucial for separating two frequencies that are very close together. For instance, you might need high resolution to distinguish a motor's running speed frequency from a sideband frequency indicating a developing fault. The trade-off is clear: to get better resolution (a smaller ) for a given , you must increase the LOR, which in turn increases the time needed to acquire the signal.
Cleaning Up the Signal
The FFT has one major assumption: that the finite chunk of the signal you've captured repeats perfectly and infinitely. In reality, it almost never does. This mismatch between the start and end of the time sample creates a discontinuity, causing energy to "leak" from its true frequency into adjacent frequency bins. This can smear a sharp, distinct peak, making it look broad and short, potentially masking smaller, nearby peaks.
To solve this, we apply a windowing function. A window is a mathematical function that is multiplied with the time signal, forcing it to taper smoothly to zero at the beginning and end. This removes the sharp discontinuity and drastically reduces spectral leakage.
There are many types of windows, each with different trade-offs:
- Hanning: A great general-purpose window. It provides good frequency resolution and significantly reduces leakage.
- Flat Top: Use this when amplitude accuracy is paramount, and frequency resolution is less critical. It produces a very accurate amplitude reading but results in a wider peak, making it harder to separate close frequencies.
Choosing the right window is essential for getting accurate data.
Finally, to improve data reliability, we use averaging. A single FFT snapshot can be noisy or influenced by transient events. By taking multiple snapshots and averaging them, we reduce random noise and get a more stable, repeatable spectrum that reflects the machine's true steady-state condition. Combining this with overlap processing, where each new snapshot reuses a portion of the data from the previous one, allows for faster updates to the averaged spectrum without waiting for entirely new data blocks to be collected.
Why is a raw time waveform of vibration data often converted into the frequency domain?
What is the primary trade-off when you increase the Lines of Resolution (LOR) for a given maximum frequency ()?
Understanding how to manipulate these signal processing parameters is what separates basic data collection from expert analysis. The right settings can reveal a fault signature with perfect clarity, while the wrong ones can hide it completely.