Mastering the Science of Disease Detection
Measuring Disease Frequency
Counting What Matters
To understand and fight disease, we first need to count it. Epidemiology isn't just about identifying germs; it's about measuring their impact on a population. This process starts with basic but powerful tools: proportions, ratios, and rates. These aren't just abstract maths terms. They are the bedrock of public health, helping officials at the Nigeria Centre for Disease Control (NCDC) decide where to focus resources, whether it's for a Lassa fever outbreak in Edo State or managing hypertension rates in Lagos.
A proportion tells you what fraction of a group is affected. For example, if 100 people in a community of 1,000 have malaria, the proportion is 100/1,000, or 10%. The numerator (the 100 people with malaria) is always a subset of the denominator (the entire community).
A ratio compares two distinct quantities. For instance, we could compare the number of male malaria patients to female patients. If there are 60 male cases and 40 female cases, the ratio is 60 to 40, or 3:2. The two groups don't overlap.
A rate is the most dynamic measure. It tells us how fast something is happening by introducing time into the equation. For example, we might measure the number of new cholera cases per week. Rates are crucial for tracking the speed and direction of an outbreak.
A Snapshot vs. a Movie
Two of the most fundamental measures of disease frequency are prevalence and incidence. They might sound similar, but they tell very different stories.
Prevalence is like taking a photograph. It captures the number of existing cases, both old and new, in a specific population at a single point in time. If we surveyed a village today and found 50 people with HIV out of a population of 2,000, we could calculate the prevalence. It gives us a static picture of the overall burden of a disease.
Incidence, on the other hand, is like watching a movie. It measures the rate at which new cases appear in a population over a period of time. To calculate incidence, you need to follow a group of people who are initially disease-free and count how many of them develop the disease over, say, a year. This group is known as the —people who are susceptible to getting the disease.
Think of it this way: Prevalence asks, “How many people have this disease right now?” Incidence asks, “How many people are getting this disease over time?”
Prevalence is influenced by two things: the incidence rate and the duration of the disease. A chronic, non-fatal disease like hypertension might have a low annual incidence but a very high prevalence because once a person is diagnosed, they have it for life. In contrast, a disease with a short duration, like a common cold or even a severe but quick illness like Ebola, could have a high incidence during an outbreak but a low prevalence at any single moment because people either recover or die relatively quickly.
Calculating Rates with Precision
While the basic incidence formula is simple, real-world studies are messy. People may enter or leave a study at different times, or be followed for different lengths of time. To handle this, epidemiologists use a more precise measure called person-time. Instead of just counting people in the denominator, we sum up the total amount of time each person was observed and at risk of the disease. This gives us an incidence density rate.
This method gives a more accurate picture, especially in long-term studies. Two other important metrics are attack rates and case-fatality rates.
An attack rate is technically a proportion, not a rate, but it's used to describe the proportion of an exposed group that becomes ill during a specific, usually short, period. It's invaluable during outbreak investigations. For example, if 300 people attend a wedding and 90 later develop food poisoning from the jollof rice, the attack rate for that dish is (90 / 300) * 100 = 30%.
A [{
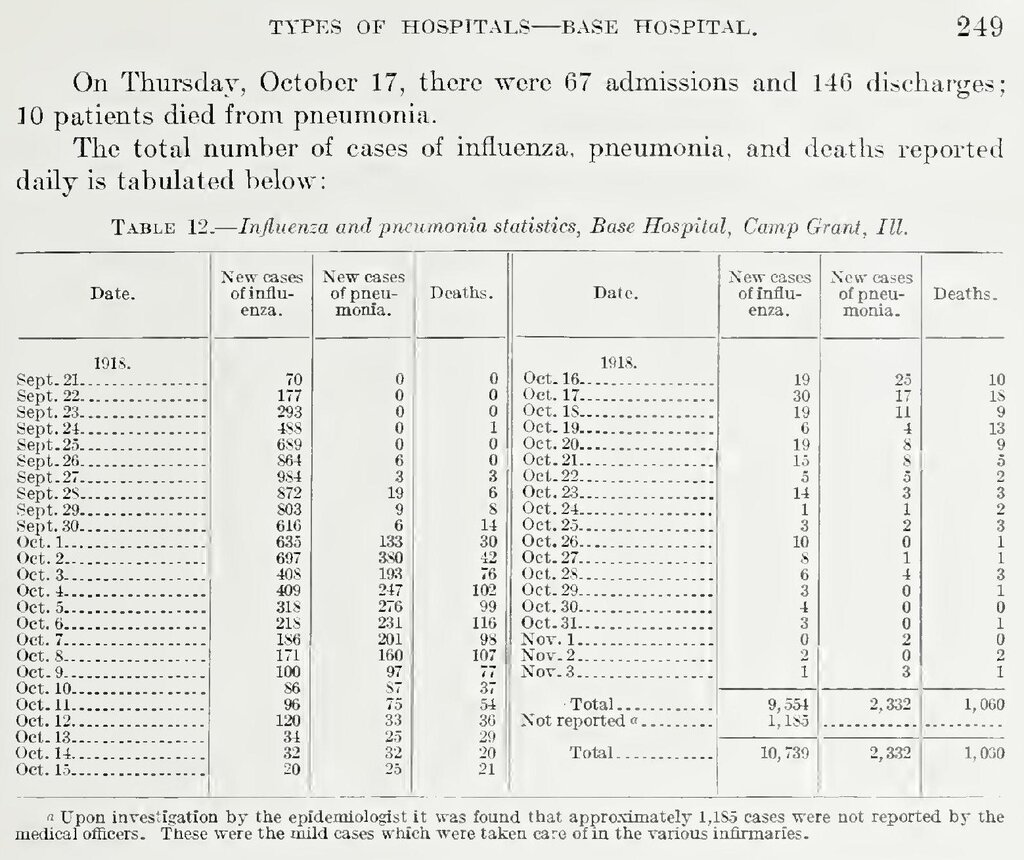
Tracking these numbers—incidence, prevalence, mortality, and fatality—is the fundamental job of an epidemiologist. It turns anecdotes and fears into hard data that can be used to see patterns, identify causes, and ultimately, save lives.
Which of the following best describes a 'rate' in epidemiology?
In a community of 5,000 people, a survey conducted on June 1st found that 200 people were currently sick with typhoid fever. Which term best describes this finding?