Mastering the Median
Introduction to Central Tendency
Finding the Center of Your Data
When you have a set of data, one of the first things you might want to know is, "What's a typical value?" If you have a list of test scores for a class, for example, you'd want a single number that represents how the class did overall. This single, representative number is what statisticians call a measure of central tendency.
Central tendency is a way to describe the center of a data set with a single value. It lets us know what is normal or 'average' for that set.
There are three main ways to measure central tendency: the mean, the median, and the mode. Each gives you a different way of looking at the data's center, and the best one to use depends on the situation.
The Mean: A Familiar Average
The most common measure of central tendency is the mean, which is just the arithmetic average. You've probably calculated it many times. You simply add up all the values in your data set and then divide by the number of values.
Mean
noun
The sum of all values in a dataset divided by the number of values.
If we represent our data set as , the formula for the mean (represented by the Greek letter , pronounced 'myoo') is:
Let's say a student's scores on five quizzes are 88, 92, 85, 95, and 90. To find the mean, you add them up ($88 + 92 + 85 + 95 + 90 = 450$) and divide by the number of quizzes (5). The mean score is $450 / 5 = 90$.
The mean is great because it uses every value in the dataset, giving a well-rounded picture. However, it has one major weakness: it's very sensitive to extreme values, also known as outliers.
Imagine if that same student scored a 20 on their next quiz. The new mean would drop to 78.3, which doesn't really represent their typical performance. This is why the mean can sometimes be misleading.
The Median: The Middle Ground
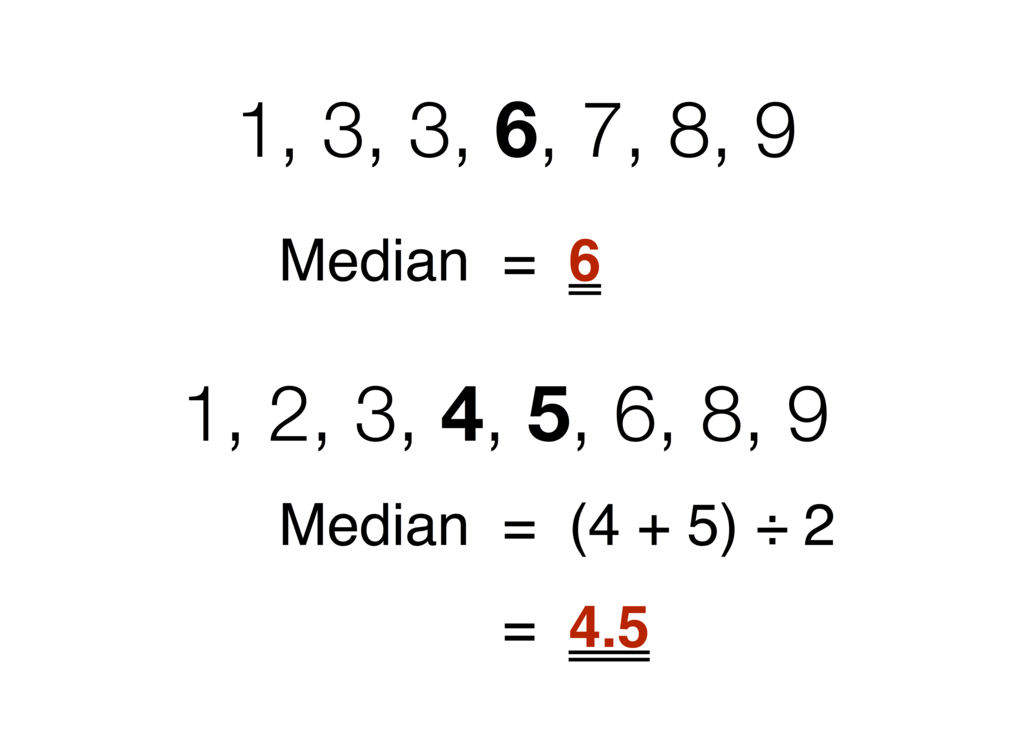
The median is the middle value in a dataset that has been arranged in order from smallest to largest. It's the number that splits the data in half: 50% of the values are above it, and 50% are below it.
Median
noun
The middle value in a sorted dataset.
To find the median, you just line up your numbers and find the one in the middle. If you have an even number of data points, the median is the average of the two middle numbers.
Because the median focuses on position, it isn't affected by outliers. Let's look at those quiz scores again, including the low score: 20, 85, 88, 90, 92, 95. The two middle numbers are 88 and 90. The median is their average, which is 89. This is much closer to the student's typical performance than the mean of 78.3.
This resistance to outliers makes the median a very useful measure, especially for skewed data like income or housing prices, where a few very high values can make the average misleadingly high.
The Mode: The Most Popular
The mode is the simplest measure of central tendency. It's the value that appears most frequently in a dataset.
Mode
noun
The value that occurs most often in a dataset.
A dataset can have one mode, more than one mode (bimodal or multimodal), or no mode at all if every value occurs only once. For example, in the dataset {Red, Blue, Blue, Green, Red, Blue}, the mode is Blue because it appears three times, more than any other color.
The mode is the only measure of central tendency that can be used for categorical data (data that isn't numerical). You can't calculate the average favorite color, but you can find the most popular one.
Choosing the Right Measure
So, which measure should you use? It depends entirely on your data and what you want to communicate.
| Measure | When to Use It | Main Weakness |
|---|---|---|
| Mean | For numerical, symmetrical data with no outliers. | Sensitive to extreme values (outliers). |
| Median | For numerical data that is skewed or has outliers. | Ignores the actual values of most data points. |
| Mode | For categorical data or to find the most common item. | Can be ambiguous if there are multiple modes. |
Imagine we're looking at the salaries of 10 employees at a small company:
$45k, $50k, $50k, $55k, $60k, $65k, $70k, $75k, $80k, $250k
- Mean: $80,000. The high salary of the CEO ($250k) pulls the average up significantly.
- Median: $62,500. This is the average of the two middle salaries ($60k and $65k) and gives a better sense of a 'typical' employee's salary.
- Mode: $50,000. This tells us the most common salary in the company.
In this case, the median is likely the best measure to describe the central tendency of salaries. The mean is skewed by the outlier, and the mode only represents the lowest-paid group.
Ready to test your understanding of these core statistical concepts?
Which measure of central tendency is most affected by extreme values, also known as outliers?
What is the median of the following set of test scores: 88, 92, 85, 95, 90, 20?
Understanding mean, median, and mode is the first step in summarizing and making sense of data. They are the fundamental building blocks of descriptive statistics.