Mastering Systems Dynamics and Leverage
Advanced Causal Loop Mapping
The Grammar of Systems
Think of a Causal Loop Diagram (CLD) not as a rough sketch, but as a schematic for a complex circuit. Just as electronics have strict rules for how components are represented, professional CLDs follow a clear grammar. This ensures anyone can read your model and understand the system's dynamics precisely.
The most important rule concerns your variables, which are the 'components' of your system. Variables in a CLD must be nouns or noun phrases that represent a measurable quantity. They should be things you can, at least in theory, track on a chart over time. Avoid using verbs or action phrases.
Instead of "Training Employees," use "Employee Skill Level." Instead of "Marketing a Product," use "Public Awareness." Instead of "Fixing Bugs," use "Number of Bugs."
This discipline forces clarity. "Employee Skill Level" can go up or down, while "Training Employees" is an action that happens. This shift is critical for building a model that accurately reflects behavior. Good variables are the foundation of a good —a theory, expressed as a CLD, that explains a specific, observed behavior over time.
Polarity and Loops
The connections between your variables are the 'traces' on your circuit board. They carry influence from one component to another. Each connection needs a polarity sign to show the nature of that influence.
| Polarity | Symbol | Meaning |
|---|---|---|
| Same | s or + | When variable A increases, variable B increases relative to what it would have been. If A decreases, B decreases. They move in the same direction. |
| Opposite | o or - | When variable A increases, variable B decreases relative to what it would have been. If A decreases, B increases. They move in the opposite direction. |
Once you've mapped the variables and their connections, you can identify the feedback loops. A loop's identity is determined by the number of 'o' links it contains.
An even number of 'o' links (including zero) creates a Reinforcing (R) loop. These amplify change and produce exponential growth or collapse.
An odd number of 'o' links creates a Balancing (B) loop. These seek equilibrium and try to correct deviations from a goal.
The Role of Delay
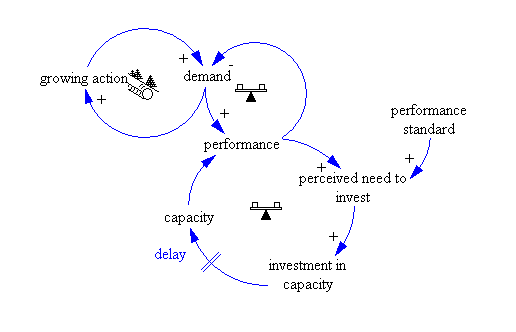
In electronics, signal propagation isn't instant. The same is true in organizational or social systems. These delays are often where the most interesting and counterintuitive behaviors originate. In a CLD, a significant delay is marked with a double line (//) across a connection.
Imagine a software project. A rise in Customer Pressure leads to an increase in Management Pressure, which then increases Overtime Hours. This seems straightforward. However, the link between Overtime Hours and Developer Burnout has a delay. Burnout doesn't happen overnight. Similarly, the link from Developer Burnout to Code Quality is also delayed. This latency can cause managers to misattribute the source of bugs, creating 'noise' that travels through the system.
Let's map this scenario. We want to understand why project deadlines are repeatedly missed despite the team working harder.
This model represents a dynamic hypothesis: the attempt to solve the problem (B1 loop) inadvertently strengthens a vicious cycle (R1 loop) due to delays, making the problem worse over time. This is a classic systems archetype called "".
By mastering this grammar, you move from simply drawing connections to building rigorous models that explain complex behaviors and reveal leverage points for effective change.
Ready to test your understanding?
Which of the following is the best-formulated variable for a Causal Loop Diagram?
In a Causal Loop Diagram, what does a double line (//) across a link between two variables indicate?
With these principles, your diagrams become powerful tools for analysis.