Mastering Strategic Stock Market Investing
Financial Statement Analysis
Reading the Company's Story
Every public company tells a story, not in words, but in numbers. This story is captured in three key documents: the Balance Sheet, the Income Statement, and the Cash Flow Statement. Understanding how to read them is like learning the language of business. Together, they reveal a company's health, its performance over time, and its ability to generate cash.
One critical step to understanding effective financial statement analysis is gaining in-depth knowledge of the balance sheet, income statement, and cash flow statement.
The Balance Sheet Snapshot
Think of the Balance Sheet as a photograph of a company's financial position on a single day. It shows what the company owns (Assets) and what it owes (Liabilities). The difference between the two is what belongs to the owners, or shareholders (Equity).
This relationship is captured by a fundamental equation that must always, without exception, be true.
Imagine you buy a ₹10 lakh house. You pay ₹2 lakh in cash and take a ₹8 lakh loan. Your asset is the ₹10 lakh house. Your liability is the ₹8 lakh loan. Your equity is the ₹2 lakh you put in. The equation balances. A company's balance sheet works the same way, just with more zeroes.
The Income Statement Performance
If the Balance Sheet is a photo, the Income Statement (also called the Profit & Loss or P&L statement) is a video. It shows a company's financial performance over a period, like a quarter or a year. It starts with total revenue and subtracts various costs and expenses to arrive at the final profit or loss.
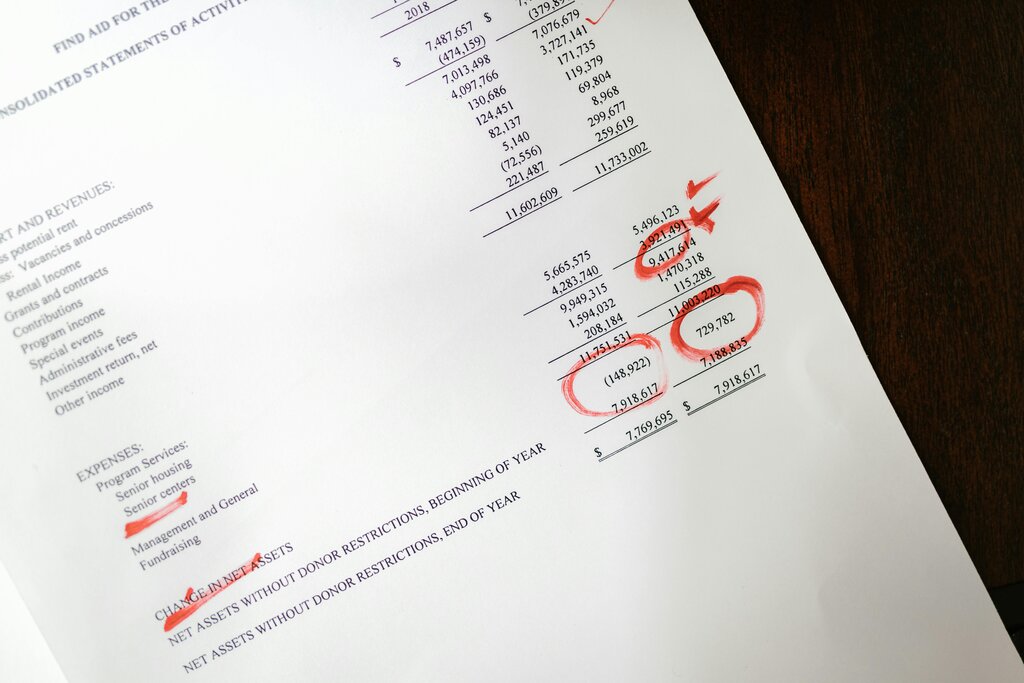
Key lines to watch are:
- Revenue (or Sales): The total amount of money generated from sales of goods or services. This is the 'top line'.
- Cost of Goods Sold (COGS): The direct costs tied to producing the goods sold by a company.
- Gross Profit: Revenue minus COGS. It shows how efficiently a company makes its products.
- Operating Expenses: Costs not directly related to production, such as salaries, marketing, and rent.
- Operating Income: Gross profit minus operating expenses. This figure reveals the profit from core business operations, before interest and taxes.
- Net Income: The famous 'bottom line'. This is the profit left after all expenses, including interest and taxes, have been deducted from revenue. This is the profit available to for reinvestment or dividends.
The Cash Flow Statement Reality
Profit is an opinion, but cash is a fact. A company can report high net income but still run into trouble if it doesn't have enough cash to pay its bills. The Cash Flow Statement (CFS) tracks the movement of actual cash into and out of the company. It's the ultimate reality check and is broken into three parts:
- Cash Flow from Operating Activities (CFO): Cash generated by the company's main business operations. A healthy, mature company should consistently generate positive cash flow here.
- Cash Flow from Investing Activities (CFI): Cash used for investments in assets, like buying new equipment or acquiring another company. This is often negative for growing companies.
- Cash Flow from Financing Activities (CFF): Cash flow between a company and its owners and creditors. This includes issuing stock, paying dividends, or repaying debt.
Connecting the Dots with Ratios
Reading the statements is the first step. The real insight comes from using the numbers to calculate financial ratios. These ratios help you compare a company's performance against its own history, its competitors, and industry benchmarks. They turn raw data into actionable intelligence.
Let's explore some of the most powerful ratios for evaluating profitability, leverage, and operational efficiency.
First, we have two key measures of profitability: Return on Equity and Return on Capital Employed.
Return on Equity (ROE)
noun
A measure of financial performance calculated by dividing net income by shareholders' equity. It represents the rate of return for ownership interest.
However, ROE can be misleading if a company has a lot of debt. A more comprehensive measure is (ROCE), which considers both debt and equity.
Next, let's look at a company's debt level. The Debt-to-Equity ratio is a simple but powerful gauge of financial risk.
Finally, we can look at profit margins to see how efficiently the company converts revenue into profit. Two common ones are Operating Margin and Net Profit Margin.
| Ratio | Formula | What It Shows |
|---|---|---|
| Operating Margin | The profitability of the core business before interest and taxes. | |
| Net Profit Margin | The percentage of revenue left after all expenses have been deducted. |
A company with high and stable (or growing) profit margins typically has a competitive advantage, like a strong brand or superior technology, allowing it to command better pricing.
The fundamental accounting equation that governs the Balance Sheet is: Assets = __________ + Equity.
If the Balance Sheet is a snapshot of a company's financial position at a single point in time, what is the Income Statement?
By combining insights from all three statements and using these key ratios, you can move beyond reading the numbers and start to understand the true story of a company's financial health.