Mastering Stock Investment Analysis
Understanding Financial Statements
The Big Three Financial Statements
Think of a company's financial health like a person's physical health. A doctor doesn't just take your temperature and call it a day. They use a few different tools—a stethoscope, a blood pressure cuff, maybe some lab tests—to get a complete picture. Similarly, to understand a company's financial situation, you need to look at three key documents: the income statement, the balance sheet, and the cash flow statement.
The three key financial statements work together. The Balance Sheet, Income Statement, and Cash Flow Statement form a complete picture of profitability, stability, and cash management.
Each statement tells a different part of the story. Together, they give you a clear view of how a company is performing, what it's worth, and how it manages its money.
The Balance Sheet
The balance sheet is a snapshot of a company's financial position at a single moment in time. It answers two fundamental questions: What does the company own? And what does it owe?
Everything a company owns is called an asset. This includes cash, inventory, equipment, and buildings. Everything it owes is a liability. This includes loans, bills to suppliers, and employee salaries.
The difference between what it owns and what it owes is called shareholders' equity. This is the value that would be left for the owners if the company sold all its assets and paid off all its debts. These three parts are connected by a fundamental rule known as the accounting equation.
This equation must always balance, hence the name. It shows that a company's assets are financed by either borrowing money (liabilities) or by using money from its owners and its own past profits (equity).
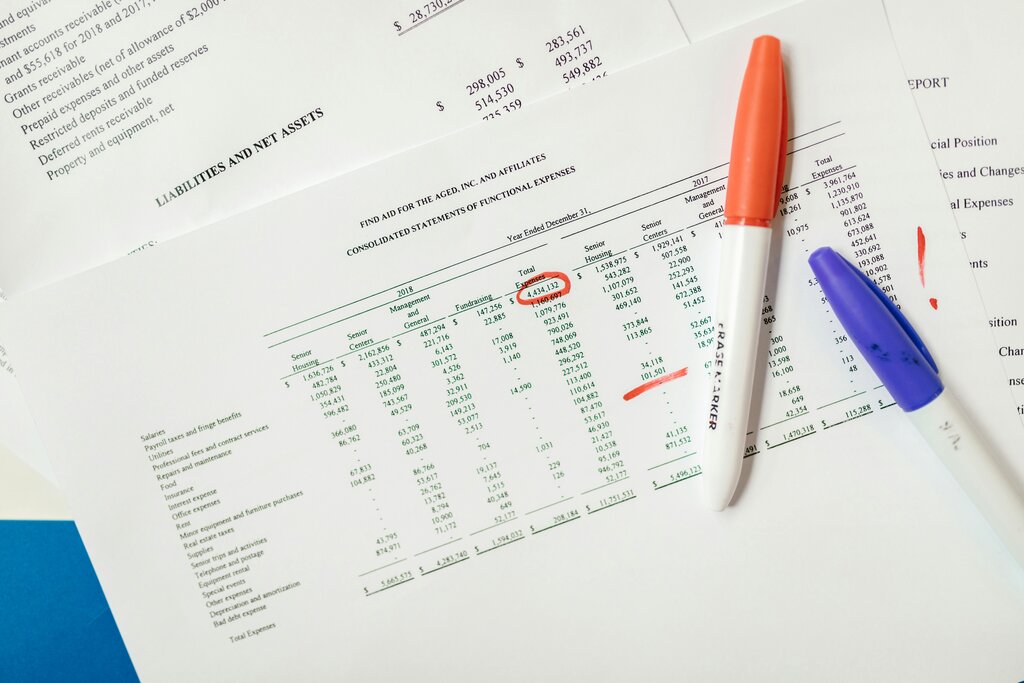
The Income Statement
While the balance sheet is a snapshot, the income statement is more like a video. It shows a company's financial performance over a specific period, such as a quarter or a year. It's often called the Profit and Loss (P&L) statement because it boils down to one simple question: Did the company make money?
The income statement starts with revenue, which is all the money a company earned from selling its products or services. Then, it subtracts all the expenses incurred to generate that revenue, like the cost of goods sold, marketing costs, salaries, and taxes. What's left at the bottom is the net income, or the company's total profit.
A consistently profitable company will show positive net income on its income statements over time. Losses, on the other hand, signal potential problems.
The Cash Flow Statement
A company can be profitable on paper (according to its income statement) but still run out of money. This happens because the income statement includes non-cash items, like depreciation, and doesn't always reflect the exact timing of cash payments. The cash flow statement solves this problem by tracking the actual cash moving in and out of a company.
It breaks down cash flows into three activities:
- Operating Activities: Cash generated from the company's main business operations, like selling goods and services.
- Investing Activities: Cash used to buy or sell long-term assets, such as property or equipment.
- Financing Activities: Cash from investors or banks, as well as cash paid to shareholders or used to repay debt.
By adding up the cash from these three areas, the statement shows the net change in a company's cash over the period. A healthy company typically generates more cash than it uses, especially from its core operations.

Putting It Together with Ratios
Reading each statement is helpful, but the real insights come from connecting the numbers using financial ratios. Ratios help you compare a company's performance over time or against its competitors. Two of the most common ratios for investors are Earnings Per Share (EPS) and the Price-to-Earnings (P/E) ratio.
Earnings Per Share (EPS) tells you how much profit the company made for each share of its stock. It's a quick way to gauge profitability on a per-share basis.
A higher EPS is generally better, and consistent growth in EPS over time is a positive sign.
The Price-to-Earnings (P/E) Ratio compares the company's stock price to its earnings per share. It gives you a sense of how much investors are willing to pay for each dollar of the company's earnings.
A high P/E ratio might suggest that investors expect high future growth, while a low P/E ratio could mean the stock is undervalued—or that the company is facing challenges. It's most useful for comparing companies in the same industry.
These three statements and a few key ratios provide the foundation for analyzing a company. They allow you to look past the headlines and understand the real financial story.