Mastering Statistical Foundations for Research
Introduction to Statistics
What is Statistics Anyway?
Statistics is the science of making sense of data. It’s a toolkit for collecting, analyzing, and interpreting information to understand the world around us. From figuring out the average customer rating for a new phone to determining if a new medicine is effective, statistics helps us find patterns and make informed decisions.
Think of it as a structured way of dealing with uncertainty. Instead of just guessing, we use data to draw logical conclusions.
The entire field is often split into two main areas. The first is descriptive statistics, which is all about summarizing and organizing data. The second is inferential statistics, which involves using that data to make predictions or generalizations about a larger group. In this article, we'll focus on the first part: describing what we see.
Describing Your Data
Before you can make any grand conclusions, you need to understand the data you have. Descriptive statistics gives you the tools to do just that. We'll start by finding the “center” of the data, and then we'll look at how spread out it is.
Imagine you have the test scores for a small class of nine students: 75, 80, 80, 85, 88, 90, 92, 95, 100.
How did the class do overall? To answer this, we can look for the central point of these scores using a few different methods.
Mean
noun
The arithmetic average of a set of numbers. It's calculated by summing all the values and dividing by the count of values.
The formula for the mean (represented by , pronounced "x-bar") is:
For our class scores, the sum is 785. Since there are 9 students, the mean is . This is the score you'd get if every student had performed equally.
Median
noun
The middle value in a dataset that has been arranged in numerical order.
Our scores are already in order: 75, 80, 80, 85, 88, 90, 92, 95, 100.
The middle number is 88. The median is useful because it isn’t skewed by extremely high or low values (outliers).
Mode
noun
The value that appears most frequently in a dataset.
In our list of scores, the number 80 appears twice, more than any other score. So, the mode is 80. A dataset can have more than one mode or no mode at all.
Measuring the Spread
Knowing the center of your data is helpful, but it doesn't tell the whole story. Imagine two cities where the average daily temperature is 70°F. In one city, the temperature is almost always between 65°F and 75°F. In the other, it swings wildly from 40°F to 100°F. The average is the same, but the experience of living there is completely different.
This is why we also need to measure variability, or how spread out the data points are.
Range
noun
The difference between the highest and lowest values in a dataset.
For our test scores, the highest is 100 and the lowest is 75. The range is $100 - 75 = 25$. This gives us a quick, but basic, sense of the spread.
For a more robust measure, we often use variance and standard deviation. They tell us the average distance of each data point from the mean.
Variance
noun
The average of the squared differences from the mean. A larger variance means the data is more spread out.
The standard deviation is simply the square root of the variance. It's often easier to interpret because it's in the same units as the original data (in our case, points on a test).
A small standard deviation means the data points are clustered tightly around the mean, while a large standard deviation means they are spread far apart.
The Logic of Chance
Statistics isn't just about describing data we already have; it's also about understanding uncertainty. This is where probability theory comes in. It's the mathematical foundation for figuring out how likely something is to happen.
Probability is a number between 0 and 1, where 0 means an event is impossible and 1 means it's certain.
The probability of a coin landing on heads is 0.5. The probability of the sun rising tomorrow is very close to 1. In research, we use probability to determine how likely it is that our results happened by random chance versus a real effect. For example, if we test a new drug and see an improvement, probability helps us figure out if that improvement is statistically significant or just a fluke.
Over many observations, random events often follow predictable patterns called probability distributions. One of the most common is the normal distribution, famously known as the bell curve.
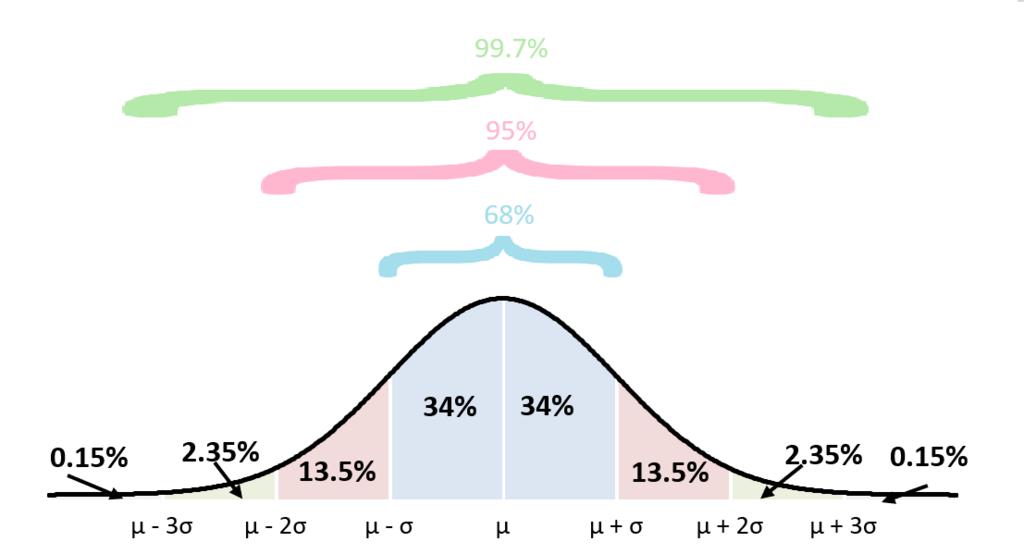
Many natural phenomena, like people's heights or measurement errors, follow this pattern. Understanding these distributions allows researchers to make sense of variability and make predictions.
By combining descriptive statistics with the principles of probability, we build a foundation for drawing meaningful conclusions from data. This is crucial not just in formal research but in making better decisions in business, medicine, and everyday life.
Let's check your understanding of these core concepts.
A researcher is summarizing the average test scores for a single classroom. Which branch of statistics are they primarily using?
What is the median of the following dataset: 10, 30, 20, 50, 40?