Mastering R for Data Analysis
Introduction to R
Getting Started with R
R is a programming language built specifically for statistical analysis and data visualization. Think of it as a super-powered calculator that can handle complex data operations. While you can use R by itself, it’s much easier to work with using RStudio.
RStudio is an Integrated Development Environment (IDE) for R. It's a workbench that gives you a text editor for writing scripts, a console to run commands, and windows to view your variables, plots, and help files all in one place. It makes programming in R much more organized and user-friendly.
To get started, you'll need to install both. First, download and install R from the Comprehensive R Archive Network (CRAN). Then, download and install the free RStudio Desktop version.
Speaking R's Language
Like any language, R has its own grammar, called syntax. The most fundamental concept is creating a variable, which is like a named container for a piece of data. In R, we typically use the <- operator to assign a value to a variable. This is read as "gets."
# Create a variable named 'x' and assign the value 10 to it.
x <- 10

# The hash symbol (#) creates a comment. R ignores everything after it on the same line.
You can also use the equals sign (=) for assignment, but using <- is a strong convention in the R community. It makes it clear that you are assigning a value, not testing for equality (which uses ==).
R is also case-sensitive, meaning that myVariable is different from myvariable.
Once you have a variable, you can see its value by simply typing its name in the console and hitting Enter, or by using the print() function.
# Print the value of x
print(x)

# This also works in the console
x
R's Building Blocks
Everything you work with in R has a specific data type. These are the most basic categories of information. The three most common ones you'll encounter are numeric, character, and logical.
| Data Type | Description | Example |
|---|---|---|
| Numeric | Any number, including decimals and integers. | 15.5, -100, 0 |
| Character | Text data, always enclosed in double " or single ' quotes. | "hello", 'R' |
| Logical | Represents truth values. | TRUE, FALSE |
You create variables of these types through simple assignment.
# A numeric variable
my_age <- 30

# A character variable
my_name <- "Alex"

# A logical variable
is_data_scientist <- TRUE
If you're ever unsure what type of data a variable holds, you can use the class() function to find out.
class(my_age) # Returns "numeric"
class(my_name) # Returns "character"
class(is_data_scientist) # Returns "logical"
Organizing Your Data
Storing single values is useful, but data analysis usually involves collections of values. R provides several data structures to organize your data, each with its own purpose.
vector
noun
A one-dimensional sequence of data elements of the same type.
Vectors are the simplest data structure in R. You can create them using the combine function, c().
# A numeric vector
sales <- c(150, 220, 185)

# A character vector
months <- c("Jan", "Feb", "Mar")

# A logical vector
high_sales <- c(FALSE, TRUE, TRUE)
A key rule for vectors is that all elements must be of the same data type. If you try to mix types, R will force them into a single, more flexible type, a process called coercion.
For two-dimensional data, you can use a matrix. A matrix is like a vector, but with rows and columns. All its elements must also be of the same type.
# Create a matrix with 2 rows and 3 columns
# The elements fill the matrix column by column by default
my_matrix <- matrix(c(1, 2, 3, 11, 12, 13), nrow = 2, ncol = 3)

print(my_matrix)
What if you need to store different data types together? For that, you use a list. A list is a versatile container where each element can be any type of R object—even another vector or list.
# A list containing a character string, a number, and a vector
my_list <- list(name = "Product A", id = 123, sales = c(150, 220, 185))

print(my_list)
Finally, the most important data structure for data analysis in R is the data frame. You can think of a data frame as a table, like a spreadsheet. It's a list of vectors of equal length, where each vector represents a column. This structure is powerful because each column can have a different data type, but all elements within a column must be the same type.
# Create a data frame from our vectors
sales_data <- data.frame(Months = months, Sales = sales, HighSales = high_sales)

print(sales_data)
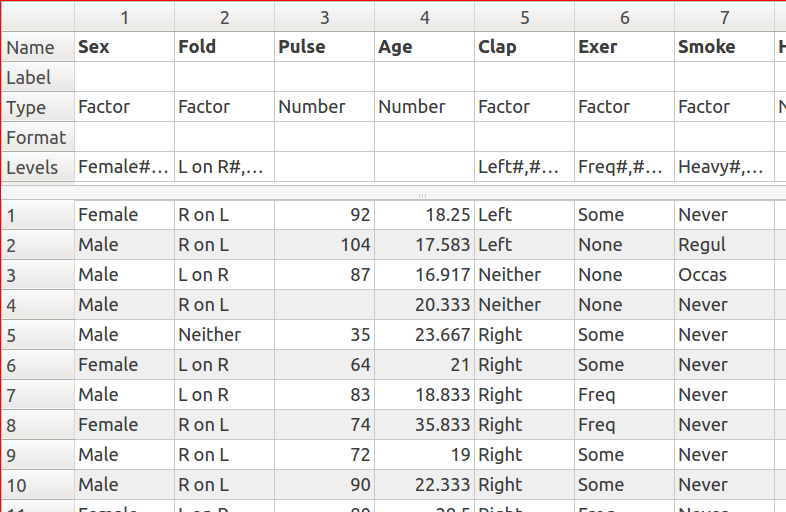
Data frames are the standard way to store tabular data in R, and they are the foundation for most statistical modeling and data manipulation you'll perform later.
Let's check your understanding of these fundamental concepts.
What is the primary role of RStudio in the context of the R programming language?
Which symbol is the conventional and most widely recommended operator for assigning a value to a variable in R?
You now have the basic building blocks for working in R. You know how to set up your environment, write simple commands, and, most importantly, how to store and organize different types of data. These concepts are the foundation for everything else you'll do in R.