Mastering Python DataFrames for Beginners
Tabular Data Concepts
Beyond Lists and Dictionaries
In Python, you've likely used lists and dictionaries to store data. A list of dictionaries is a common pattern for managing a collection of related records. For instance, you could store information about users like this:
users = [
    {"name": "Alice", "age": 34, "city": "New York"},
    {"name": "Bob", "age": 29, "city": "London"},
    {"name": "Charlie", "age": 41, "city": "Tokyo"}
]
This works, but it can be inefficient. If you wanted to get a list of all user ages, you'd have to loop through the entire structure to pick out each value. For large datasets, this becomes slow and cumbersome.
# To get all ages, we need a loop
ages = []
for user in users:
    ages.append(user['age'])

print(ages) # Output: [34, 29, 41]
This approach forces you to think about your data one record at a time. For data analysis and AI, it's often more useful to think about the data as a whole table, where you can perform operations on entire columns at once.
Thinking in Rows and Columns
A more powerful way to organize structured data is in a table with rows and columns. This might sound like a spreadsheet, and that's a great starting point for the mental model. Each row represents a single, complete record—like one user. Each column represents a specific attribute or feature for all records, like 'name' or 'age'.
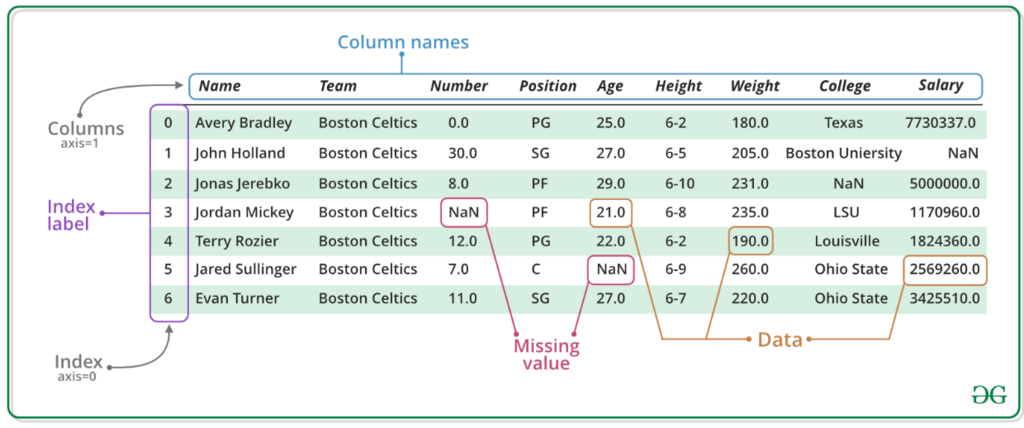
In this row-and-column format, grabbing all the ages is as simple as selecting the 'age' column. This is not only easier to write but also vastly more efficient because data science libraries are optimized for these kinds of column-based operations.
In tabular data, columns represent features, and rows represent individual observations.
What is a DataFrame?
In the world of Python data science, this spreadsheet-like object is called a DataFrame. It's the central data structure in libraries like Pandas and Pixeltable. A DataFrame is a two-dimensional, size-mutable, and potentially heterogeneous tabular data structure with labeled axes (rows and columns).
DataFrame
noun
A two-dimensional data structure that organizes data into a table of rows and columns, similar to a spreadsheet. It is a core component of data analysis libraries like Pandas.
While a DataFrame looks and feels like a simple table, it's a powerful programmable object. Each column in a DataFrame is its own data structure, often a Series, which is like a one-dimensional array. This structure is what makes it so efficient.
The layout of a DataFrame is defined by its schema. The schema is essentially a blueprint of the table, specifying the column names and the type of data stored in each column (e.g., integer, string, boolean).
A DataFrame's schema defines its structure: the names and data types of its columns.
This structure has a key property: columns are typically homogeneous, meaning every item in a single column is of the same data type. All values in the 'age' column should be integers, and all values in the 'name' column should be strings.
However, the DataFrame as a whole is heterogeneous. It can hold many different data types, with one column of integers, another of strings, and a third of floating-point numbers. This combination of same-type columns and different-type tables gives you both consistency and flexibility.
| Column Name | Data Type | Homogeneous? |
|---|---|---|
user_id | Integer | Yes |
username | String | Yes |
is_active | Boolean | Yes |
last_login | Datetime | Yes |
Understanding this shift from simple data structures like lists to the organized, schema-driven model of a DataFrame is the first step toward effective data management in Python for data science and AI. It provides the foundation you need to clean, transform, and analyze data at scale.