Mastering Production Machine Learning
Machine Learning Foundations
Learning from Data
Machine learning is the art of teaching computers to learn from patterns in data, rather than being explicitly programmed for every task. Instead of writing step-by-step rules, we feed an algorithm examples and let it figure out the rules for itself.
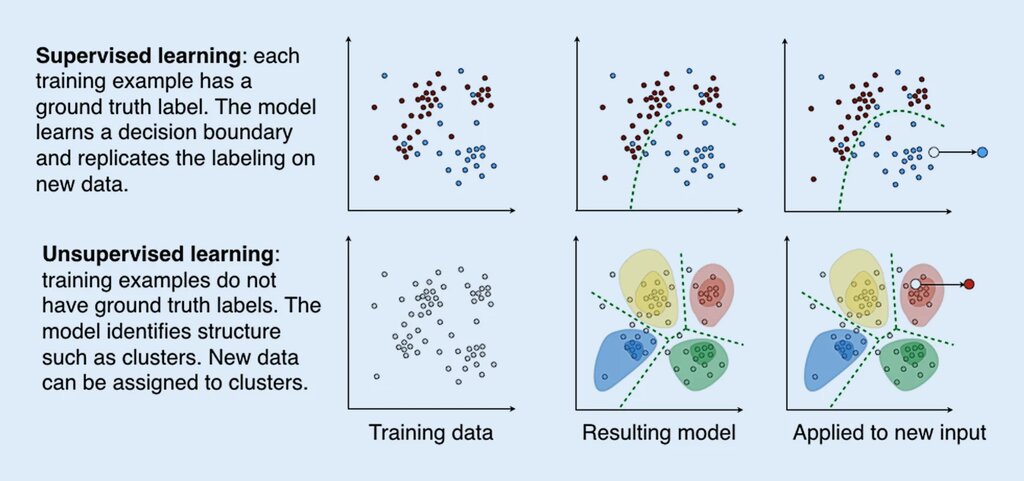
There are two main styles of teaching a machine. You can give it a problem with an answer key, or you can give it a puzzle and ask it to find the patterns on its own. These two approaches are called supervised and unsupervised learning.
Learning with an Answer Key
Supervised learning is like studying with flashcards. Each card has a question on one side (the input data) and the correct answer on the other (the label). The goal is for the machine to learn the relationship between the questions and answers so it can eventually predict the answer for a new, unseen question.
This type of learning handles two main kinds of problems: regression and classification.
A regression problem is about predicting a continuous number, like a price or a temperature. A classification problem is about choosing a category, like 'spam' or 'not spam'.
One of the simplest yet most powerful regression algorithms is Linear Regression. It tries to find the best straight line that describes the relationship between an input and an output. Think about predicting a house's price based on its size. As the size increases, the price generally goes up. Linear regression finds the line that best captures this trend.
For classification, we often turn to Logistic Regression. Despite its name, it's not for predicting a number line. Instead, it predicts a probability. It squashes its output to be a value between 0 and 1. We can then set a threshold, say 0.5, to make a decision. For instance, if the algorithm calculates the probability of an email being spam is 0.8 (which is greater than 0.5), it classifies the email as 'spam'.
Another popular classification tool is the Decision Tree. It works by creating a model that predicts the value of a target variable by learning simple decision rules inferred from the data features. It's like a flowchart of 'if-then-else' questions that splits the data into smaller and smaller groups.
Finding Patterns on Its Own
Unsupervised Learning is different. Here, we don't give the model any answer key. The data is unlabeled. The goal is for the algorithm to explore the data and find some structure on its own. It's like handing someone a box of mixed Lego bricks and asking them to sort them into piles based on color, shape, and size.
The most common task in unsupervised learning is clustering, which involves grouping similar data points together. This is incredibly useful for tasks like customer segmentation, where a company might want to find natural groupings of customers based on their purchasing behavior to create targeted marketing campaigns.
How Good Is the Model?
Creating a model is one thing, but knowing if it's any good is another. We need to evaluate its performance. We do this by holding back a portion of our data during training, called a test set. After the model is trained, we use this test set to see how well it performs on data it has never seen before.
For classification models, a common starting metric is accuracy. It's the simplest measure: the proportion of predictions the model got right.
But accuracy can be misleading, especially if you have an imbalanced dataset. For example, if a model is trained to detect a rare disease that only affects 1% of the population, a lazy model could simply predict that no one has the disease and be 99% accurate! Yet, it would be useless in practice because it never finds the people who are actually sick.
To handle this, we use more nuanced metrics. The F1 Score is one such metric. It combines two other scores: precision (how many of the positive predictions were actually correct?) and recall (how many of the actual positives did the model find?). The F1 score provides a single number that balances both concerns.
A high F1 score indicates that the model is performing well on both precision and recall, giving us more confidence in its predictions, especially when one class is much rarer than another.
What is the fundamental difference between supervised and unsupervised machine learning?
You are tasked with building a model to predict the exact price of a house based on its square footage. Which algorithm is most suitable for this task?
These concepts form the bedrock of machine learning. Understanding them is the first step toward building systems that can learn, predict, and help us make sense of a complex world.