Mastering Price Action Trading
Introduction to Price Action
What Is Price Action?
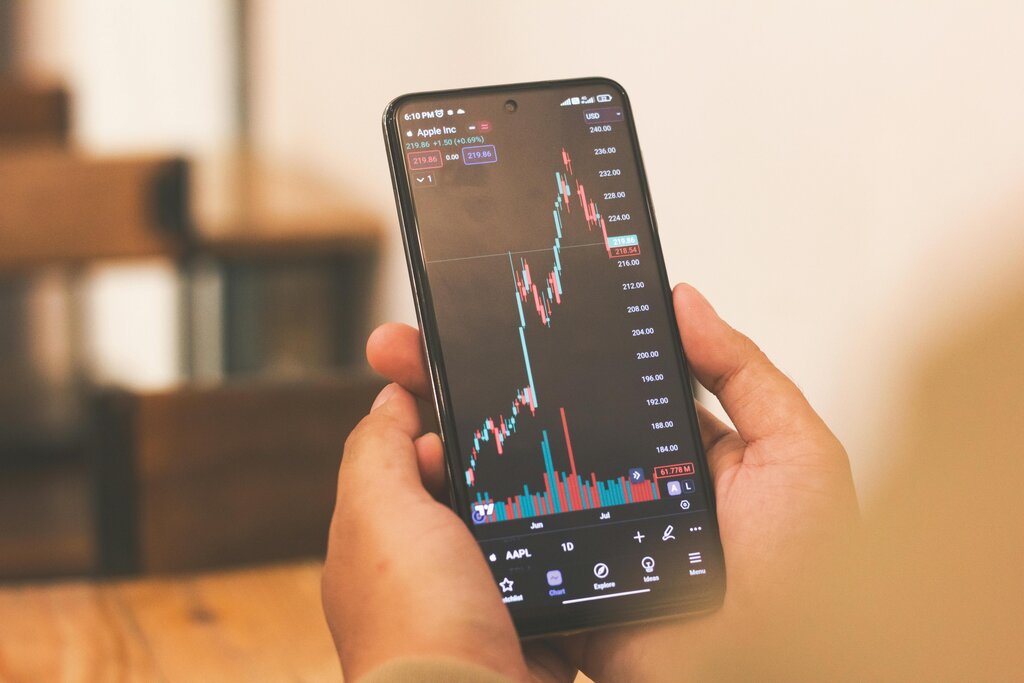
Price action is the movement of a security's price over time. When you look at a stock chart, you're looking at its price action. Price action trading is the practice of making trading decisions based purely on these movements, without relying on lagging indicators or complex analysis tools.
Think of it as reading the market's story directly from the source. Every tick up or down is a word in that story, revealing the behavior of buyers and sellers.
Why is this so important? Because ultimately, every piece of news, every earnings report, and every trader's opinion is reflected in one place: the price. A company might announce record profits, but if the price drops, it tells you the market's reaction was negative, perhaps because the good news was already expected and priced in. The price action is the final verdict.
Price Action vs. Indicators
Many traders use indicators like moving averages or the Relative Strength Index (RSI) to help them make decisions. These tools take historical price data and apply formulas to it, often displaying the result as lines or graphs overlaid on the price chart.
Price action trading takes a different approach. It focuses on the “raw” price chart. The idea is that indicators are, by their nature, lagging. They are based on what has already happened. Price action, on the other hand, is what is happening right now.
Technical analysis is the study of price action and market data to forecast future price movements.
A price action trader believes the chart itself provides all the necessary information through patterns and formations. It’s a cleaner, more direct way of viewing the market, removing the clutter of secondary indicators.
Reading Market Psychology
At its heart, price action reflects the collective psychology of all market participants. It's a visual representation of the constant battle between buyers (bulls) and sellers (bears).
When you see a long series of upward price bars, it shows that buyers are in control. Confidence is high, and people are willing to pay more and more for the asset. Conversely, a sharp drop in price indicates that sellers have taken over, and fear or pessimism is the dominant mood.
Every price swing, big or small, is a footprint of the market's collective mood.
Imagine a stock consistently rises to $50 but fails to go higher, pulling back each time. This area is known as resistance. The price action is telling you that at $50, there are enough sellers willing to cash out to overwhelm the buyers. This isn't a random event; it's a clear psychological barrier visible on the chart. By learning to identify these areas, traders can make more informed decisions about when to buy or sell.
Ready to check your understanding?
What is the fundamental principle of price action trading?
A stock repeatedly rises to 100 level as what?
By learning to read the price chart directly, you're learning the language of the market itself. This foundational skill is central to analyzing financial markets.