Mastering Power Query for Data Transformation
Introduction to Power Query
What is Power Query?
Think of Power Query as your personal data janitor. It's a tool designed to take messy, inconsistent data from various sources and clean it up before you even start your analysis. It handles the tedious, repetitive tasks of getting your data ready, so you can focus on finding insights.
Power Query is a data transformation and preparation tool available in Power BI, Excel, and Microsoft Fabric.
Instead of manually copying, pasting, and reformatting data every time you get a new report, you build a set of cleaning steps once. Power Query then remembers these steps and can apply them automatically the next time you refresh your data. It can connect to hundreds of different data sources, from simple Excel files to web pages and databases.
Getting Started
Accessing Power Query is straightforward in both Excel and Power BI, though the button labels differ slightly. The goal is always to get data from a source, which then opens the Power Query Editor.
| Application | How to Access Power Query |
|---|---|
| Excel | Go to the Data tab and look for the Get & Transform Data section. Click Get Data to start. |
| Power BI | On the Home ribbon, click Get data or Transform data. Both will open the Power Query Editor. |
Once you connect to a data source, you'll land in the main workspace: the Power Query Editor. This is where all the data transformation happens. It opens in a separate window, so you can work on your data without altering your original Excel sheet or Power BI report canvas.
The Editor Interface
The Power Query Editor might look complex at first, but it’s organized into a few key areas. Understanding these components is the first step to mastering data transformation.
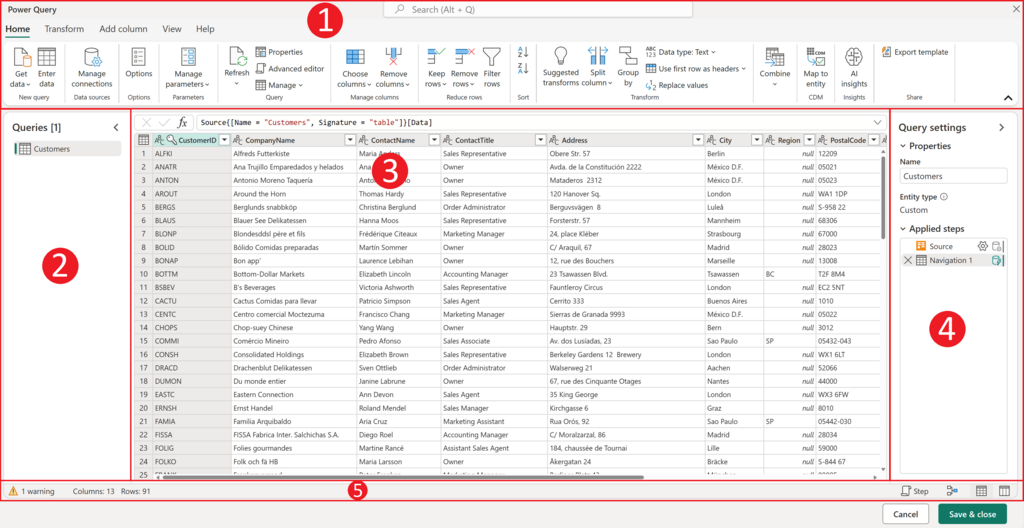
Let's break down the main parts you'll interact with most often.
- The Ribbon: Similar to other Microsoft products, the ribbon at the top contains tabs like Home, Transform, and Add Column. These tabs house all the different transformation commands you can apply to your data, such as removing columns, splitting text, and changing data types.
- Queries Pane: On the left side, this pane lists all the data connections, or queries, you've made in your current file. You can select, rename, and organize your different queries here.
- Data Preview: This is the main window in the center, showing a preview of your data for the selected query. It's where you see the transformations happen in real-time. It doesn't show your entire dataset, just enough rows to give you a clear picture.
- Query Settings & Applied Steps: This pane on the right is perhaps the most important. Every time you perform an action, like removing a column or filtering a row, Power Query records it as a step in the "Applied Steps" list. This creates a repeatable sequence. You can click on any step to see what the data looked like at that point, modify the step, or delete it. It’s like a recipe for your data cleanup.
The real power of Power Query is in the "Applied Steps" list. It makes your data cleaning process transparent, editable, and repeatable.
With a basic understanding of this environment, you're ready to start transforming data. The key is to explore the options in the ribbon and watch how each action adds a new step to your query's recipe.
Ready to check your understanding of the Power Query environment?
What is the primary function of Power Query?
In the Power Query Editor, which area allows you to see, edit, or remove the specific cleaning actions you've performed?
Now you know your way around the editor. Next, we'll dive into performing some basic transformations.