Mastering Power BI for Data Insights
Introduction to Power BI
What is Power BI?
At its core, Power BI is a tool that helps you make sense of data. Think of all the information a business collects: sales figures, customer feedback, website traffic, inventory levels. Power BI takes this raw data and turns it into clear, interactive visuals like charts and graphs. This process is often called business intelligence, or BI.
Power BI is a data visualization and business intelligence tool that allows users to connect to various data sources, clean and transform data, and build visual dashboards that tell compelling data stories.
Instead of staring at a massive spreadsheet, you can look at a colorful dashboard that instantly tells you what's working and what isn't. It helps people spot trends, share insights, and make smarter decisions based on facts, not guesswork.
The Power BI Family
Power BI isn't just one single application. It's a suite of tools that work together, often called the Power BI ecosystem. Each part has a specific job.
| Component | Primary Use | Platform |
|---|---|---|
| Power BI Desktop | Connect to data, model it, and build reports | Windows Application |
| Power BI Service | Share reports, create dashboards, and collaborate | Web-based (Cloud) |
| Power BI Mobile | View and interact with reports and dashboards | iOS & Android App |
Think of it like a workshop. Power BI Desktop is your main workbench where you build everything. You connect to your data sources, clean up the information, and design your reports with charts and tables. It's a free application you install on your computer.
Once your report is built, you publish it to the Power BI Service. This is the online hub where you can share your work with colleagues. Here, you can combine visuals from different reports into a single-page dashboard and control who gets to see what.
Finally, Power BI Mobile lets you and your team view these reports and dashboards on phones and tablets, so you can check in on your data from anywhere.
Get Started with Power BI Desktop
Your journey begins with Power BI Desktop. It’s the authoring tool where all the initial creation happens. The best part? It's completely free to download and use.
You can download Power BI Desktop directly from the Microsoft Store on Windows or from the official Power BI website. The installation is straightforward—just follow the on-screen prompts.
Once you open the application, you'll see the main canvas. It might look a bit empty at first, but it's organized into a few key areas.
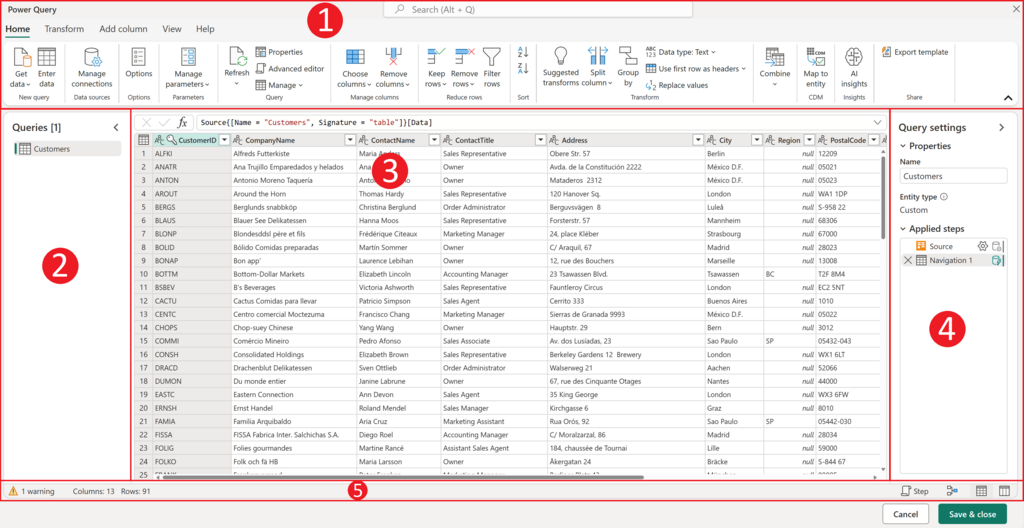
On the left side, you'll find three main views:
- Report View: This is where you'll build your visuals. It’s the canvas for your charts, maps, and tables.
- Data View: Here, you can see the underlying data in a table format, much like a spreadsheet. It's useful for inspecting your data and making small adjustments.
- Model View: This view shows you how your different data tables are connected. It's like a blueprint of your data structure.
On the right side, you have the Fields, Visualizations, and Filters panes. The Fields pane lists all your data tables and columns. To create a chart, you simply drag a field onto the canvas. The Visualizations pane lets you choose the type of chart you want, and the Filters pane helps you narrow down the data shown in your reports.
Don't worry about mastering everything at once. The first step is just getting familiar with the layout. In the upcoming sections, we'll start pulling in some data and creating our first visual.
What is the primary purpose of Power BI?
Which component of the Power BI ecosystem is the primary tool for authoring and designing reports on your local computer?