Mastering Power BI for Data Analytics
Introduction to Power BI
What Is Power BI?
At its core, Power BI is a tool that helps you make sense of data. It takes raw numbers and text from spreadsheets, databases, or cloud services and turns them into clear, interactive visuals. Think of it as a bridge between messy data and smart decisions.
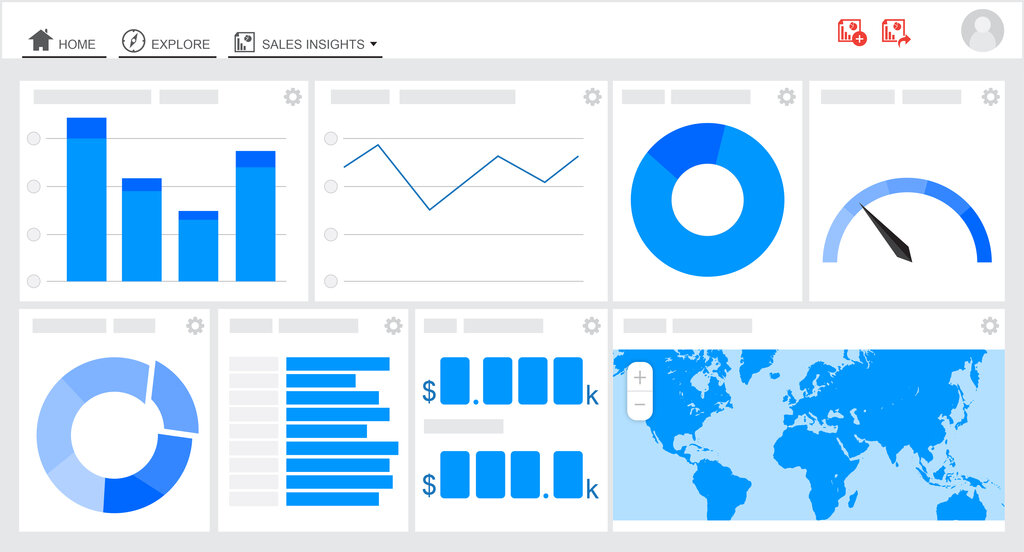
Power BI is an incredibly powerful tool for turning raw data into stunning visuals and actionable insights.
The Power BI ecosystem has two main parts that work together:
- Power BI Desktop: This is a free application you install on your computer. It’s your workshop, where you connect to data, clean it up, and build reports filled with charts and graphs.
- Power BI Service: This is an online, cloud-based service (app.powerbi.com). Once you've built a report in Desktop, you publish it to the Service. This is where you can share your reports, combine visuals into dashboards, and collaborate with your team.
Getting Started
Your journey begins with Power BI Desktop. Since it's where all the development happens, that's what you'll need to install first.
You can download Power BI Desktop for free directly from the Microsoft Store on Windows or from the official Power BI website. The installation is straightforward, just like any other application.
Once installed, you can open the application and start exploring. You don't need a license to use Power BI Desktop for learning and building reports.
A Quick Tour of the Interface
When you first open Power BI Desktop, the interface might seem busy, but it's organized into a few key areas. Understanding these sections is the first step to feeling comfortable with the tool.
Here’s a breakdown of the main components:
- The Ribbon: At the top, you'll find the ribbon, which contains common tasks and tools, organized into tabs like Home, Insert, and Modeling. This is where you'll get data and add new elements to your report.
- The Views: On the left-hand side, there's a small navigation pane with three icons. These switch between the core views:
- Report View: The default view, where you build your visualizations on the canvas.
- Data View: This lets you see the data in your tables, much like a spreadsheet.
- Model View: Here, you can see and manage the relationships between your data tables.
- The Panes: On the right, you have several panes that are crucial for building reports:
- Fields: Once you load data, all your tables and columns will appear here. You'll drag these fields onto the canvas to create visuals.
- Visualizations: This is your palette of charts and graphs. You select a visual here, then drag fields into it.
- Filters: This pane allows you to apply filters to your entire report, a specific page, or just a single visual.
The Basic Workflow
Working in Power BI generally follows a consistent process. You start with raw data and end with a shareable report or dashboard.
Let's walk through what each step means.
- Connect to Data: Power BI can connect to hundreds of different data sources, from a simple Excel file on your computer to a complex SQL database or a web service.
- Transform & Model: Rarely is data perfect from the start. This step involves cleaning and shaping your data using a tool called Power Query Editor. You might remove errors, split columns, or combine tables. This is also where you define relationships between tables in the Model view.
- Visualize: This is the fun part. In the Report view, you drag data fields onto the canvas and choose different visuals to represent them. You can create bar charts, maps, tables, and much more to tell a story with your data.
- Publish & Share: Once your report is ready, you publish it from Power BI Desktop to the Power BI Service. From there, you can share it with colleagues, create dashboards that update in real-time, and allow others to interact with your findings.
This workflow—from connecting to raw data to sharing polished insights—is the foundation of business analytics, and Power BI provides an integrated environment to handle every step of the process.
What is the primary purpose of Power BI?
In which part of the Power BI Desktop interface would you find your palette of available charts and graphs?