Mastering Power BI for Data Analysis
Introduction to Power BI
What Is Power BI?
Think of business data as a giant pile of puzzle pieces. On their own, they don't mean much. Power BI is the tool that helps you assemble those pieces into a clear picture. It's a business intelligence tool from Microsoft designed to take raw data from different sources and turn it into interactive, easy-to-understand visuals.
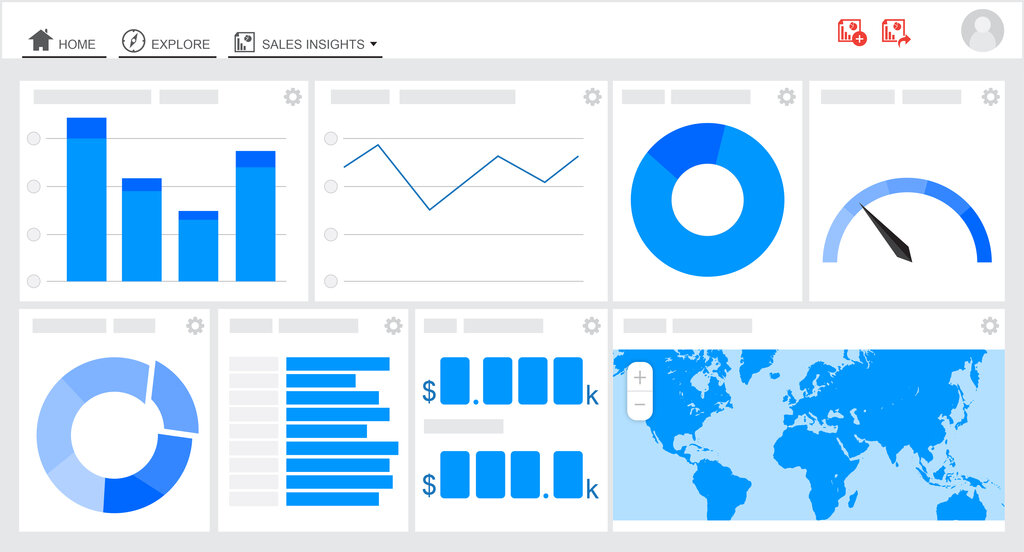
Power BI is a data visualization and business intelligence tool that allows users to connect to various data sources, clean and transform data, and build visual dashboards that tell compelling data stories.
The goal is simple: to help you and your organization make smarter, data-driven decisions. Instead of guessing, you can see trends, track performance, and uncover insights. You can connect to hundreds of data sources, from a simple Excel spreadsheet to complex cloud-based databases.
The Power BI Trio
The Power BI ecosystem isn't just one single application. It's a collection of three core components that work together seamlessly. This trio allows you to go from raw data on your computer to a shared report on a colleague's phone.
Let's break down each part of this workflow.
1. Power BI Desktop This is the main authoring tool. It's a free application you install on your Windows computer. Think of it as your workshop. Here, you connect to your data sources, clean up the data (a process called transformation), and design reports by dragging and dropping elements to create charts, graphs, and maps.
2. Power BI Service Once you've built a report in Power BI Desktop, you publish it to the Power BI Service. This is a cloud-based service (SaaS, or Software as a Service) that you access through a web browser. It's the central hub for collaboration. Here you can combine visuals from different reports into a single-page dashboard, share your work securely with colleagues, and set up automatic data refreshes to keep your reports up to date.
3. Power BI Mobile Apps For insights on the go, there are Power BI Mobile apps for iOS and Android devices. These apps allow you to access and interact with your published reports and dashboards from anywhere. You can view data, filter it, and even set up alerts to notify you when certain data points change.
Desktop is for creating, the Service is for sharing, and Mobile is for viewing.
Part of a Bigger Family
Power BI doesn't exist in a vacuum. It's deeply integrated with other Microsoft products, which is a major part of its appeal. It works hand-in-hand with tools you might already use every day.
| Integration | How It Works |
|---|---|
| Excel | You can analyze Power BI data in Excel or import Excel files directly into Power BI. |
| Microsoft 365 | Embed interactive Power BI reports directly into SharePoint Online pages or Microsoft Teams channels. |
| Azure | Power BI connects seamlessly to various Azure data services, like Azure SQL Database and Azure Synapse Analytics, for powerful, large-scale data analysis. |
This tight integration means you can build a comprehensive data culture within your organization, using familiar tools to access powerful insights. The journey starts with understanding these basic building blocks. From here, you can begin to connect data and build your first visualizations.
Ready to check your understanding? Let's see what you've learned.
What is the primary purpose of Power BI?
A business analyst needs to build a new report from scratch, connecting to a local SQL database and cleaning the data before creating charts. Which Power BI tool should they use for this task?
You now have a solid overview of what Power BI is and its main components. This foundation is the first step toward telling powerful stories with data.