Mastering Power BI for Data Analysis
Introduction to Power BI
What is Power BI?
Power BI is a tool from Microsoft that helps people make sense of data. Think of it as a powerful lens that can take confusing spreadsheets or databases and turn them into clear, interactive visuals. Instead of just seeing rows of numbers, you see charts, graphs, and maps that tell a story.
Power BI is a data visualization and business intelligence tool that allows users to connect to various data sources, clean and transform data, and build visual dashboards that tell compelling data stories.
Its main job is to connect to different data sources, clean up the information, and then let you build reports and dashboards. This helps businesses track their performance, spot trends, and make smarter decisions based on facts, not just guesses.
The Power BI Ecosystem
Power BI isn't just one single program. It's a collection of tools that work together. The two main parts you'll use are Power BI Desktop and the Power BI Service.
Power BI Desktop
noun
A free application you install on your local computer. This is your workshop where you connect to data, shape it, and design reports with visuals.
Think of the Desktop application as the place where you do all the heavy lifting and creative work. Once your report is ready, you share it using the Power BI Service.
Power BI Service
noun
An online cloud service (also called Power BI Online). This is where you publish your reports to share them with others. You can use it to create dashboards and collaborate with colleagues.
There are also mobile apps for Power BI, so you can view your reports and dashboards from your phone or tablet. The general workflow is to build in Desktop, then publish and share with the Service.
Core Building Blocks
Everything you create in Power BI is built from three fundamental components: datasets, reports, and dashboards. Understanding how they relate is key.
| Component | Description | Analogy |
|---|---|---|
| Dataset | A collection of data that you import or connect to. | The raw ingredients for a meal. |
| Report | One or more pages of visuals, like charts and graphs. | The finished dish, presented on a plate. |
| Dashboard | A single-page view of the most important metrics. | A sampler platter with highlights from different dishes. |
You start with a dataset. This could be anything from a simple Excel file to a complex database. Power BI connects to this data.
From that dataset, you create a report. A report can have multiple pages, and each page can be filled with different visualizations that explore the data from various angles. For example, one page might show sales over time, while another shows sales by region.
Finally, you can create a dashboard. A dashboard is a single canvas where you can "pin" the most important visuals from your reports. It gives you an at-a-glance view of your key performance indicators (KPIs). Dashboards are only created in the Power BI Service, not in the Desktop app.
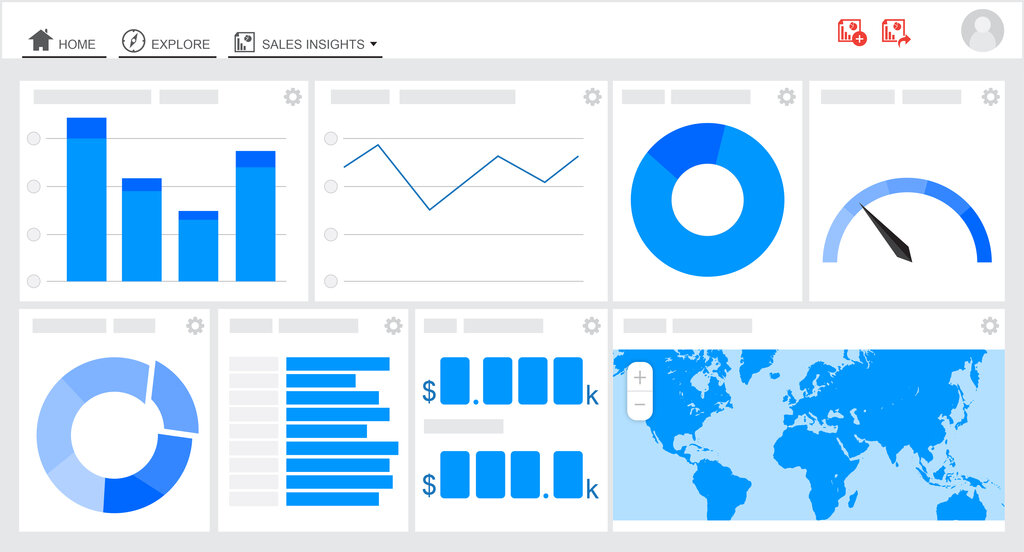
In short, you can't have a report without a dataset, and dashboards are built from visuals that live in reports. It's a clear, logical progression from raw data to high-level insight.
Now that you have a basic understanding of what Power BI is and its core components, you're ready to start exploring how to use it.