Mastering Power BI for Data Analysis
Introduction to Power BI
What Is Power BI?
Think of business data as a book written in a language you don't understand. It's full of valuable information, but you can't access it. Power BI is like a skilled translator. It takes raw, confusing data from spreadsheets, databases, and cloud services and turns it into clear, visual stories that anyone can understand.
At its core, Power BI is a business analytics tool from Microsoft. Its job is to connect to different data sources, clean up the information, and create interactive dashboards and reports. These visuals help you spot trends, gain insights, and make smarter decisions based on facts, not guesswork.
Power BI is a data visualization and business intelligence tool that allows users to connect to various data sources, clean and transform data, and build visual dashboards that tell compelling data stories.
Instead of being a single program, Power BI is a collection of software services, apps, and connectors that work together. This ecosystem lets you move seamlessly from creating a report on your computer to sharing it with your team in the cloud, and even checking key metrics on your phone.
The Power BI Family
To get the full picture, you need to know its three main parts: Power BI Desktop, the Power BI Service, and Power BI Mobile apps. Each one has a specific role, but they're designed to work together.
Think of it this way: Desktop is where you build your report, the Service is where you share and collaborate on it, and Mobile is how you access it anywhere.
Let's look at each component individually.
Power BI Desktop
This is your workshop. Power BI Desktop is a free application you install on your local computer. It's a complete, standalone tool for developing reports. Here, you'll perform the three key steps of the process:
- Connect: Pull in data from hundreds of potential sources, like an Excel file, a SQL database, or a web page.
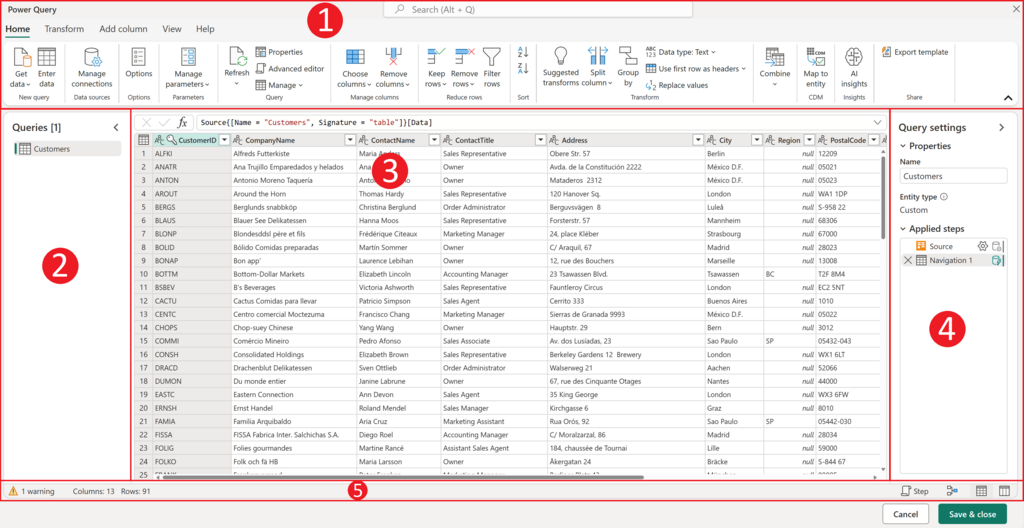
- Transform and Model: Clean up your data. This might mean removing errors, splitting columns, or creating relationships between different data tables.
- Visualize: Design reports by dragging and dropping data onto a canvas to create charts, graphs, maps, and tables.
All the report creation and deep data work happens in Power BI Desktop. Once your report is ready, you publish it to the Power BI Service.
Power BI Service
The Power BI Service is a cloud-based service, also known as Power BI Online. This is where your reports live after you've built them. Its main purpose is sharing and collaboration.
Once a report is published to the Service, you can share it securely with colleagues inside or outside your organization. You can also organize related reports and visuals into dashboards, which provide a high-level, single-page view of your most important metrics. The Service also handles tasks like setting up automatic data refreshes to ensure your reports are always up-to-date.
Power BI Mobile
As the name suggests, Power BI Mobile apps let you access your reports and dashboards on the go. There are native apps available for iOS, Android, and Windows devices. These apps are optimized for smaller screens, allowing you to view, interact with, and share your data insights from anywhere. You can even set up data-driven alerts that notify you on your phone when a key metric crosses a certain threshold.
How They Work Together
The typical workflow moves smoothly between these three components. It's a cycle of creation, sharing, and consumption.
A data analyst starts by building a report in Power BI Desktop. When it's finished, they publish it to the Power BI Service. In the Service, they can create a dashboard from that report and share it with decision-makers. Those managers can then view the dashboard in a web browser or on their phones using the Power BI Mobile app, staying on top of the latest business trends.
If a change is needed, the analyst can open the original file in Desktop, make updates, and republish it, and the changes will automatically appear for everyone who has access.
What is the primary role of Power BI in a business context?
In which Power BI component does the main work of connecting to data sources, transforming data, and designing reports take place?
This integrated system makes Power BI a powerful and flexible tool for turning data into action.