Mastering Power BI for Data Analysis
Introduction to Power BI
What is Business Intelligence?
Every day, businesses generate vast amounts of data. Sales figures, website traffic, customer feedback, inventory levels—it all adds up. But raw data is just a collection of numbers and text. It isn't useful until you make sense of it. That’s where business intelligence comes in.
Business Intelligence
noun
A technology-driven process for analyzing data and presenting actionable information to help executives, managers, and other corporate end users make informed business decisions.
Think of it like this: A lemonade stand owner has a notebook filled with daily sales. That's raw data. If they start to analyze it, they might notice they sell more lemonade on hot days and more cookies on cool days. That's an insight. Acting on that insight—making extra lemonade when the forecast is sunny—is a data-driven decision.
Business intelligence, or BI, is the process of turning raw data into useful insights that guide smart decisions. It helps answer questions like "What were our top-selling products last quarter?" or "Which marketing campaigns are bringing in the most customers?"
Meet Power BI
There are many tools designed for business intelligence, and one of the most popular is Microsoft Power BI.
Power BI is a data visualization and business intelligence tool that allows users to connect to various data sources, clean and transform data, and build visual dashboards that tell compelling data stories.
Power BI isn't just one program; it's a suite of tools that work together. This ecosystem has three main parts.
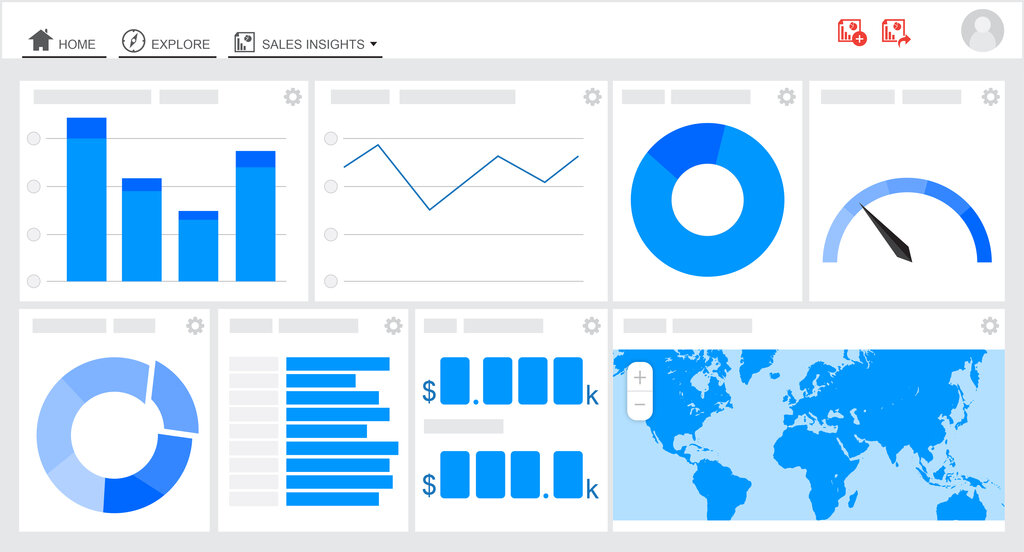
| Component | Primary Use | Platform |
|---|---|---|
| Power BI Desktop | Connect to data, transform it, and build reports. | Windows Desktop App |
| Power BI Service | Publish, share, and collaborate on reports and dashboards. | Web Browser (Cloud) |
| Power BI Mobile | View and interact with your reports on the go. | iOS & Android App |
You'll do most of the heavy lifting—connecting to data and designing your reports—in Power BI Desktop. Then, you publish your work to the Power BI Service to share it with others. The Mobile app lets you access those insights from anywhere.
How It All Connects
The flow of work in Power BI generally follows a consistent path. It starts with your data, moves to the Desktop application for development, and ends in the Service for consumption and sharing. This structured process ensures that raw data is methodically transformed into clear, interactive visuals.
This architecture allows data analysts to build complex data models and reports on their local machine without affecting others. Once a report is ready, it's published to a central, secure location in the cloud where it can be easily accessed by decision-makers.
Get Started with Power BI Desktop
Your journey begins with Power BI Desktop. It’s a free application you install on your Windows computer.
To install it, search for "Power BI Desktop" in the Microsoft Store, which is the recommended method as it handles updates automatically. Alternatively, you can download it directly from the official Microsoft Power BI website. Follow the on-screen instructions to complete the installation.
Once installed, open the application. You might see a start screen with tutorials and updates, which you can close to get to the main workspace.
The Power BI Desktop interface is where you'll build your reports. It's organized into several key areas.
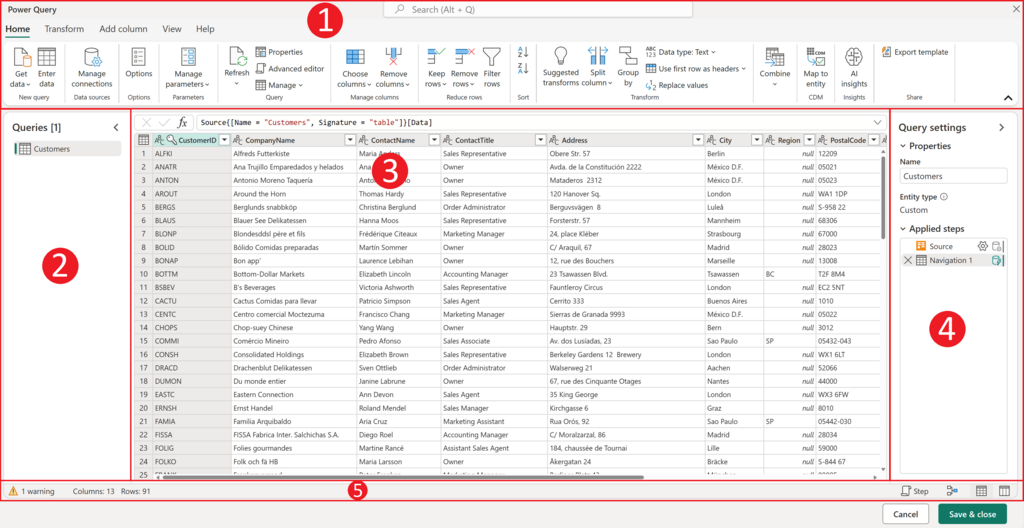
Here's a quick tour of what you're looking at:
- The Ribbon: Similar to other Microsoft products, the ribbon at the top contains common tasks and options, organized into tabs like Home, View, and Modeling.
- Views Pane: On the left, you'll see three icons. These switch between Report view (where you build visuals), Data view (where you see your raw data tables), and Model view (where you manage relationships between tables).
- Canvas: This large, central area is where you'll arrange and build the visuals for your report.
- Filters Pane: Use this area to apply filters to your entire report, a specific page, or a single visual.
- Visualizations Pane: This is where you select the type of chart or graph you want to create, like a bar chart, line chart, or map. You also configure the fields and formatting for your visuals here.
- Fields Pane: After you load data, all of your available data tables and columns will appear here. You'll drag fields from this pane onto the canvas to create visualizations.
Getting comfortable with this interface is the first step toward creating your own reports. You now have the foundational knowledge of what Power BI is, its components, and where to find the essential tools in the Desktop application.