Mastering Power BI for Business Insights
Introduction to Power BI
What is Power BI?
Power BI is a business analytics tool from Microsoft. Its main job is to take raw, messy data from different sources and turn it into clear, interactive visuals. Think of it as a bridge between jumbled numbers and smart business decisions.
Power BI is a data visualization and business intelligence tool that allows users to connect to various data sources, clean and transform data, and build visual dashboards that tell compelling data stories.
Instead of being a single program, it’s better to think of Power BI as an ecosystem with three main parts that work together: Power BI Desktop, the Power BI Service, and Power BI Mobile Apps. Each part has a specific role in the journey from raw data to actionable insights.
Power BI Desktop
This is where the creation process begins. Power BI Desktop is a free application you install on your computer. It’s a complete workshop for building reports. Here, you connect to your data sources, whether they're simple Excel spreadsheets, cloud-based databases, or hundreds of other options.
Once connected, you can clean and transform the data. This might mean removing errors, renaming columns, or combining tables. This is a crucial step called data modeling, which ensures your data is structured correctly for analysis. Finally, you use a drag-and-drop interface to create visualizations like charts, graphs, and maps. This is where your data starts to tell a story.
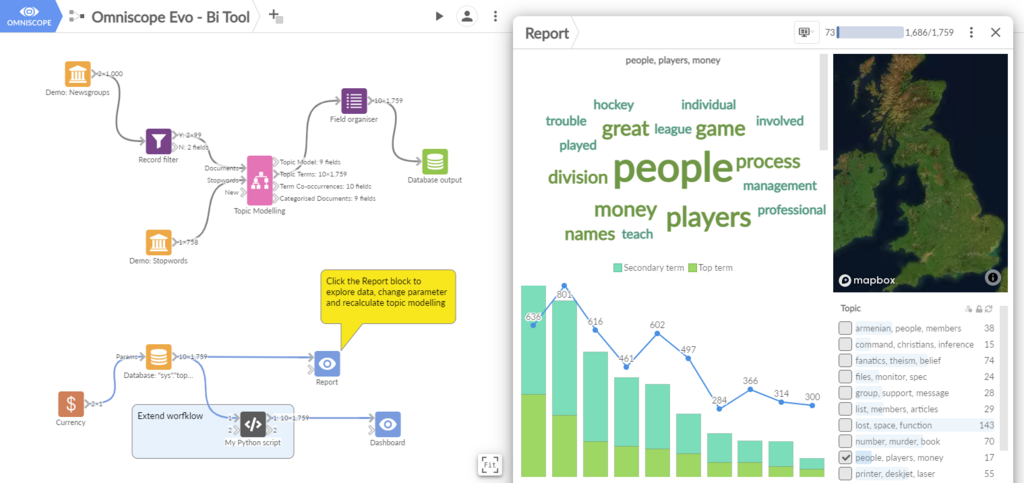
Power BI Service
After you’ve built a report in Power BI Desktop, you need a way to share it. That’s the job of the Power BI Service, a cloud-based platform (often referred to as Power BI Online). You publish your completed reports from the Desktop application to the Service.
Once a report is in the Service, you can share it with colleagues inside or outside your organization. You can assemble visuals from different reports into a single-page view called a dashboard. The Service is also where you can set up schedules for your data to automatically refresh, ensuring your reports always show the latest information without any manual work.
Think of it this way: Power BI Desktop is for building the report, and the Power BI Service is for sharing and collaborating on it.
Power BI Mobile Apps
The final piece of the ecosystem is the Power BI Mobile Apps, available for iOS, Android, and Windows devices. These apps let you access your reports and dashboards securely from anywhere. The reports are optimized for small screens, making them easy to view and interact with on the go.
You can tap on a chart to filter data, get alerts on your phone when key metrics change, and share insights with your team directly from the app. It ensures that critical business data is always at your fingertips, not just at your desk.

Together, these three components provide a complete solution for business intelligence, covering everything from initial data connection to final report consumption.
Ready to test what you've learned? Let's check your understanding of Power BI's core components.
What is the primary function of Power BI?
Which component of the Power BI ecosystem is a free application installed on your computer, used for connecting to data, modeling it, and building reports?
Now you have a solid grasp of what Power BI is and how its main parts work together to bring data to life.