Mastering Power BI for Business Insights
Introduction to Power BI
What Is Power BI?
At its core, Power BI is a tool that helps people make sense of data. Think of it as a bridge between raw, messy numbers and clear, understandable insights. Businesses collect vast amounts of information every day, from sales figures and customer feedback to website traffic and inventory levels. On its own, this data is just a jumble of facts. Power BI helps transform that jumble into visuals like charts and graphs, making it easy to spot trends, patterns, and important takeaways.
Power BI is a data visualization and business intelligence tool that allows users to connect to various data sources, clean and transform data, and build visual dashboards that tell compelling data stories.
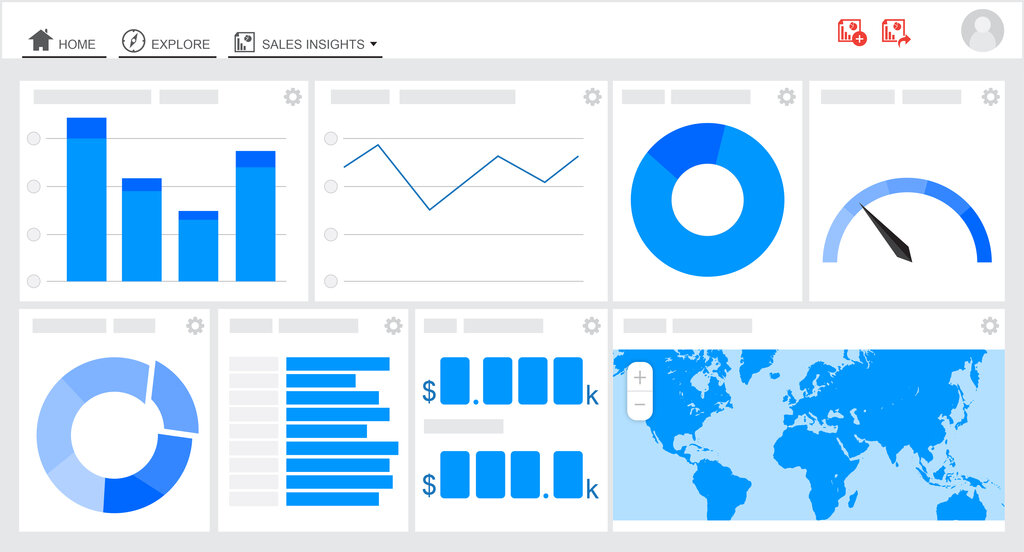
The main goal is to empower users, even those without a technical background, to connect to different data sources, combine them, and create interactive reports. These reports, often called dashboards, provide a snapshot of what’s happening in a business. Instead of digging through spreadsheets, a manager can glance at a dashboard to see which products are selling best or which marketing campaigns are performing well. This process of turning data into actionable information is known as Business Intelligence, or BI.
The Power BI Ecosystem
Power BI isn't just a single application; it's a collection of tools that work together. Understanding these key components helps clarify how you get from raw data to a shared report on your phone.
Power BI is far more than just a data visualization tool; it represents a powerful ecosystem that includes Power BI Desktop, Power BI Service, and Power BI Mobile.
The three main parts are:
-
Power BI Desktop: This is the free, downloadable application for your computer. It's the primary workshop where you connect to data, clean it up, and design your reports and visualizations. Most of the development work happens here.
-
Power BI Service: This is the cloud-based, online platform (SaaS - Software as a Service). Once you've built a report in Desktop, you publish it to the Service. Here, you can share your dashboards with colleagues, set up automatic data refreshes, and collaborate.
-
Power BI Mobile: As the name suggests, these are apps for phones and tablets (iOS, Android, and Windows). They allow you to access and interact with your published reports and dashboards from anywhere, ensuring insights are always at your fingertips.
This ecosystem design allows for a powerful and flexible workflow. An analyst can build a complex report on their desktop, publish it to the service for their team to review, and the CEO can check the key performance indicators (KPIs) on their tablet during a meeting.
The Role in Business Intelligence
So where does Power BI fit into the bigger picture of a company's strategy? Its role is to democratize data. In the past, generating business reports was often a slow process that required specialists from the IT department. Business users would request a report and wait for someone else to build it.
Tools like Power BI shift this power into the hands of the people who need the insights the most—the business users themselves. This is often called "self-service BI."
By providing an intuitive, user-friendly interface, Power BI enables marketing managers, financial analysts, and operations leads to explore data and answer their own questions. This speeds up decision-making and fosters a data-driven culture, where choices are based on evidence rather than just intuition.
In essence, Power BI is about more than just creating pretty charts. It’s a platform for telling stories with data, discovering insights that might otherwise stay hidden, and ultimately, making smarter business decisions.
What is the primary goal of Power BI in a business context?
An analyst needs to connect to several data sources, clean the data, and build a new data model and report from scratch. Which Power BI tool is designed for this development work?