Mastering Power BI
Introduction to Power BI
What Is Power BI?
Power BI is a tool from Microsoft that helps you make sense of data. Think of it as a powerful lens that can take raw, messy information from spreadsheets, databases, or even the cloud and turn it into clear, interactive visuals. Instead of staring at rows of numbers, you can see trends, patterns, and insights at a glance.
The main goal is to help people make better business decisions. With Power BI, you can create reports and dashboards that are not only easy to understand but also simple to share with your team or entire organization. It connects the dots between different pieces of data to tell a complete story.
The Core Components
Power BI is organized around three fundamental concepts: datasets, reports, and dashboards. Understanding how they work together is key to using the tool effectively.
A dataset is the collection of data you import or connect to. It's the raw material for everything you build. Power BI can pull this data from hundreds of different sources, like an Excel workbook on your computer or a cloud-based database.
A report is where you do the actual analysis. It's a multi-page canvas filled with visualizations like charts, graphs, and maps. Each page can focus on a different aspect of the data. For example, one page might show overall sales, while another drills down into performance by region. Reports are highly interactive, allowing you to filter, slice, and dice the data to uncover insights.
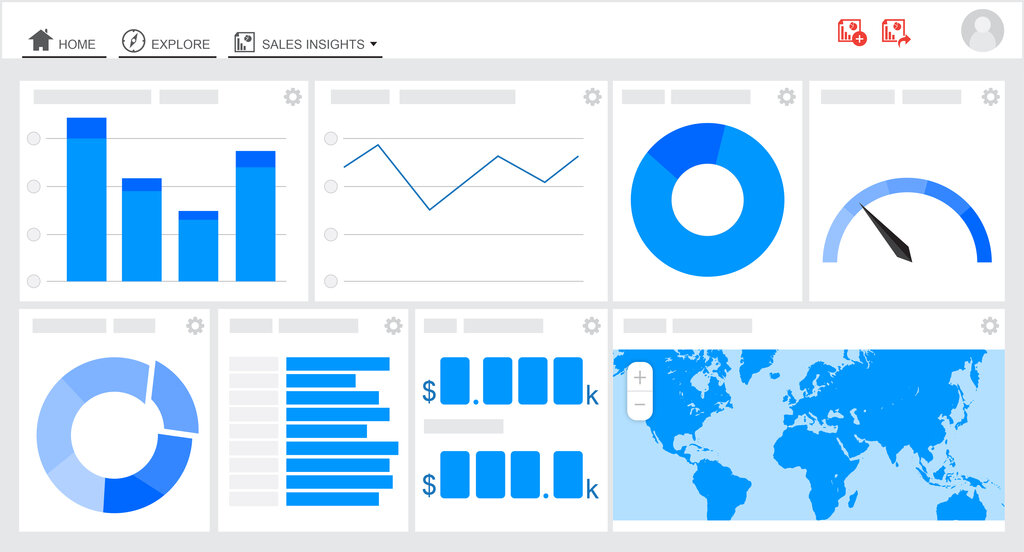
A dashboard is a single-page summary of the most important information. It's designed for monitoring key metrics at a glance. You can "pin" visualizations from different reports onto one dashboard to create a customized command center for your business. Unlike reports, dashboards are meant for viewing and monitoring, not deep exploration.
Getting Started
The journey from raw data to a finished dashboard begins with connecting to a data source. Power BI has a feature called Get Data that presents a huge menu of possible data connectors. You can connect to something as simple as a single Excel file or as complex as a collection of cloud-based business applications.
Once connected, Power BI loads a copy of the data into your file, creating the dataset. From there, you enter the report view. This is the main workspace, where you'll see a blank canvas in the middle, a Visualizations pane on the right for choosing chart types, and a Fields pane that lists all the data tables and columns in your dataset.
You build visuals by dragging fields onto the canvas or into the Visualizations pane. Power BI automatically creates a chart based on the data type, which you can then customize. This drag-and-drop interface is what makes building reports so intuitive.
Power BI provides powerful data analysis and visualization tools.
By combining different data sources, building interactive reports, and summarizing the results on a dashboard, you can create a complete picture of your business performance.
What is the primary goal of using Power BI?
What are the three fundamental concepts that Power BI is organized around?