Mastering Power BI Beyond the Basics
Star Schema Mastery
From Flat Files to a Star Schema
When you first start with Power BI, it's common to pull data in as a single, large table, often called a 'flat file'. This works for simple visualisations, but as your analysis grows more complex, performance suffers. Queries become slow, and the model becomes difficult to manage. The solution is to adopt a more structured approach used in enterprise-level reporting: the star schema.
A well-structured data model is key to Power BI performance.
A star schema organises your data into two distinct types of tables: fact tables and dimension tables. This separation is the foundation of an efficient and scalable Power BI model. It isn't just a best practice; it's fundamental to leveraging the power of Power BI's internal data engine.
Facts vs Dimensions
Understanding the difference between fact and dimension tables is the first step to building a proper data model.
Fact tables contain quantitative data about a business event. Think of them as recording the events themselves: a sale, a log entry, a measurement. They are typically tall and narrow, with millions or even billions of rows, but relatively few columns. These columns are mostly numerical values (like SalesAmount or Quantity) and keys that link to dimension tables.
Dimension tables provide the context for those events. They contain the descriptive attributes: the 'who, what, where, when, and why'. Who made the purchase? What product was sold? When did it happen? These tables are usually short and wide, with fewer rows but many columns describing the entities. For example, a Product dimension table would have columns for ProductName, Category, Colour, and Size.
| Characteristic | Fact Tables | Dimension Tables |
|---|---|---|
| Content | Measurements, metrics, transactional data | Descriptive attributes, context |
| Structure | Tall and narrow | Short and wide |
| Columns | Mostly numeric values and foreign keys | Mostly textual attributes |
| Purpose | To be aggregated (SUM, AVERAGE, etc.) | To be used for filtering and grouping |
| Example | Sales transactions, website clicks | Customers, Products, Dates |
When arranged in a model diagram, these tables resemble a star, with a central fact table connected to multiple surrounding dimension tables. This structure isn't just for looks; it's optimised for performance.
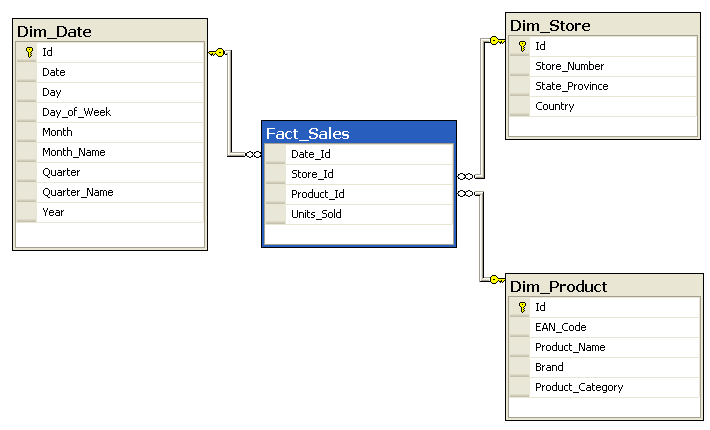
The star schema design works exceptionally well with Power BI's VertiPaq engine. This engine uses columnar compression, meaning it compresses data column by column. Dimension tables, with their repetitive text values (like 'London' appearing many times in a City column), compress remarkably well. More importantly, the star schema minimises the number of table joins needed for a query. Filtering a dimension table and then aggregating a fact table is a highly efficient operation for the engine, leading to fast and responsive reports.
Building Your Model
The connections between your tables are called relationships. In a star schema, the most common type of relationship is one-to-many (1:many). This means one row in a dimension table can be related to many rows in a fact table. For example, one customer in the Dim_Customer table can have many transactions in the Fact_Sales table. But each sales transaction is related to only one customer.
When you create this relationship, you must also define the cross-filter direction. The best practice is to set this to 'Single'. This means that filters flow 'downhill' from the dimension tables (the 'one' side) to the fact table (the 'many' side). If you select a product category, that filter will flow to the Fact_Sales table to show you sales for only that category. A single filter direction prevents ambiguity in your model, where filters could circle back unexpectedly and produce incorrect results.
Handling Complexity
Sometimes, you might encounter a situation where a dimension table is related to another dimension table. For example, a Product dimension might be linked to a Product_Subcategory dimension, which is then linked to a Product_Category dimension. This multi-level structure is known as a snowflake schema.
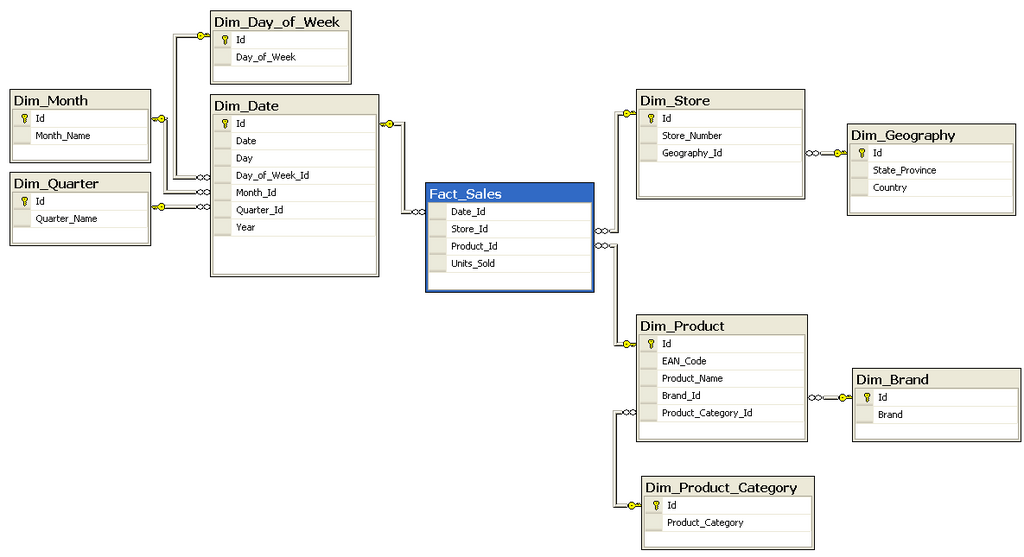
While a snowflake schema looks neat from a database normalisation perspective, it hurts performance in Power BI. Each additional level adds another table join to your queries, slowing down your reports. The best practice is to 'flatten' these snowflakes into a star. During the data transformation phase in Power Query, you should merge the related dimension tables into a single, denormalised table. For example, you would merge the Product_Category and Product_Subcategory information directly into the Dim_Product table. This creates a wider dimension table but restores the simple, high-performance star structure.
Always aim to flatten your snowflakes. A single, wide dimension table is faster than multiple, small, joined tables.
Your model can also contain multiple fact tables. For instance, you might have a Fact_Sales table and a Fact_Inventory table. These can both connect to shared dimension tables like Dim_Product and Dim_Date. This allows you to analyse sales and inventory levels together, using the same product or date filters, creating a powerful and integrated view of your business.
What is the primary role of a dimension table in a Power BI star schema?
A data model contains tables for Product, Product Subcategory, and Product Category, linked sequentially. This structure is known as a:
Adopting the star schema is a crucial step in moving from basic report building to creating professional, high-performance Power BI solutions.