Mastering Pivot Tables
Introduction to Pivot Tables
What Is a Pivot Table?
Imagine you have a huge spreadsheet filled with sales data: every transaction, every product, every region, and every date. Trying to answer a simple question like, "What were our total sales for laptops in Europe last quarter?" could mean hours of sorting, filtering, and writing formulas. A pivot table does that work for you in seconds.
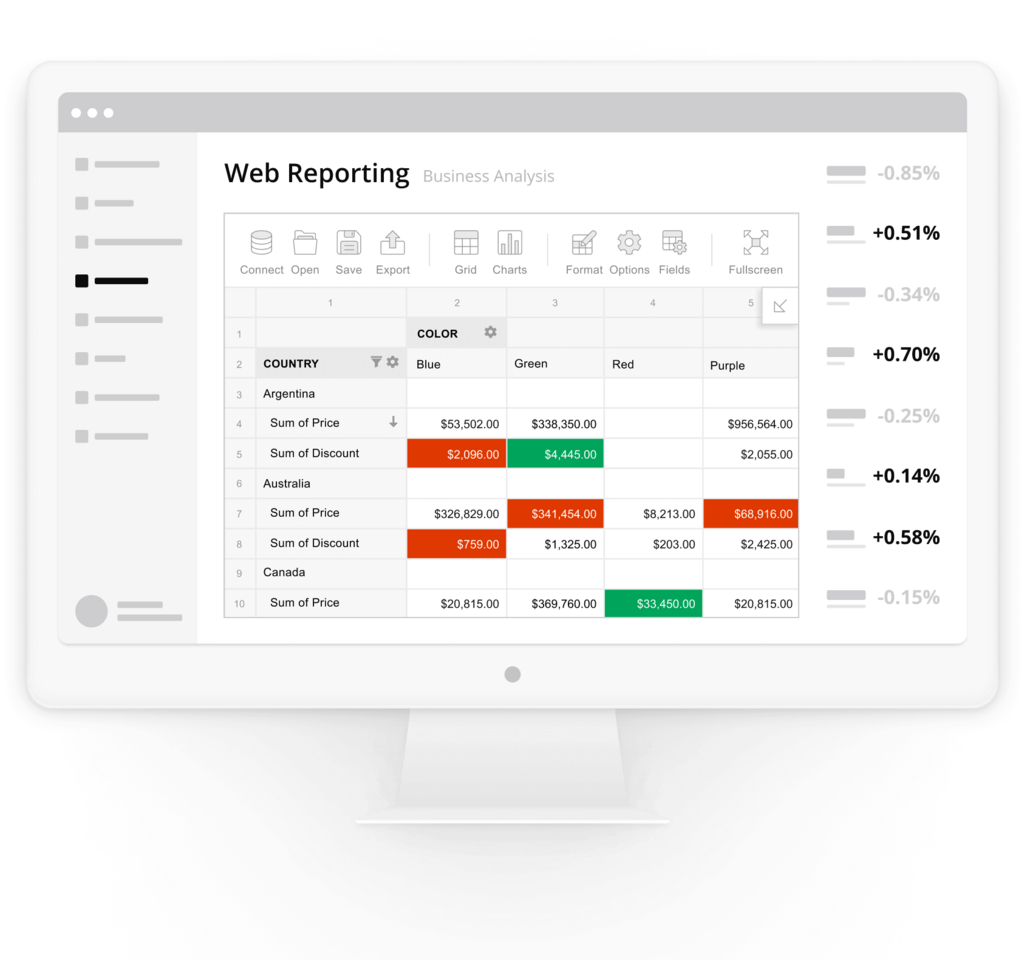
A pivot table is an interactive tool that lets you summarize and reorganize large datasets without changing the original data. It helps you quickly see relationships and trends.
Think of your raw data as a messy room full of furniture. A pivot table lets you instantly rearrange that furniture to see it from different angles. You can group all the chairs together, line up everything blue, or see how many tables fit in one corner. You can "pivot" your data—turning rows into columns or columns into rows—to get a new perspective and uncover insights that were hidden in the clutter.
Why Use a Pivot Table?
The main benefit of a pivot table is speed. It automates the process of grouping and summarizing information. Instead of manually calculating totals with functions like SUMIF or COUNTIF, you can drag and drop data fields to build a summary report on the fly.
Key benefits include:
- Quick Summarization: Instantly calculate sums, counts, averages, maximums, and minimums for any part of your data.
- Pattern Recognition: By rearranging the data, you can easily spot trends, comparisons, and outliers. For example, you can see which products are most popular or which sales regions are underperforming.
- Dynamic Analysis: Pivot tables are interactive. You can easily add, remove, or move fields to explore different questions without having to start over. This makes it a powerful tool for exploratory data analysis.
- Simple Reporting: They allow you to create clean, organized summary reports from complex datasets, which can then be used in dashboards and presentations.
Pivot tables give you the ability to rearrange and summarize your data using columns and rows that help you easily identify trends and patterns.
Pivot Tables Everywhere
This powerful feature isn't exclusive to one program. All major spreadsheet applications include their own version of pivot tables. While the specific buttons and menus might look a little different, the core functionality is the same across the board. If you learn how to use a pivot table in one program, you'll easily adapt to another.
| Software | Feature Name | Availability |
|---|---|---|
| Microsoft Excel | PivotTable | Built-in |
| Google Sheets | Pivot table | Built-in |
| LibreOffice Calc | Pivot Table | Built-in |
Now, let's check your understanding of these fundamental concepts.
What is the primary purpose of a pivot table?
Which of the following tasks is a pivot table designed to replace?
With a solid grasp of what pivot tables are and why they're useful, you're ready to start building your own.