Mastering Multivariable Regression
Introduction to Regression
Understanding Relationships in Data
Regression analysis is a statistical tool used to understand and quantify the relationship between variables. At its core, it helps us see how a variable of interest changes when another variable is adjusted. Think of it like a cause-and-effect investigation for data.
For example, a coffee shop owner might want to know if daily temperature affects the number of hot coffees they sell. Or a farmer might want to see how much rainfall influences crop yield. Regression can help answer these questions by modeling the relationship between these factors. To do this, we need to identify two types of variables.
Dependent Variable
noun
This is the main variable you are trying to predict or understand. It's the outcome or effect. It's also known as the response variable.
Independent Variable
noun
This is the variable you believe has an impact on the dependent variable. It's the factor you are using to make a prediction. It's also known as a predictor or explanatory variable.
Putting Regression to Work
Regression analysis is incredibly versatile and is used across many fields. Its main purposes are to forecast future outcomes and to understand the strength of relationships between variables.
In finance, it might be used to predict stock prices based on economic indicators. In marketing, it can help determine how much ad spending impacts sales. In healthcare, it could be used to analyze how factors like diet and exercise affect a patient's blood pressure.
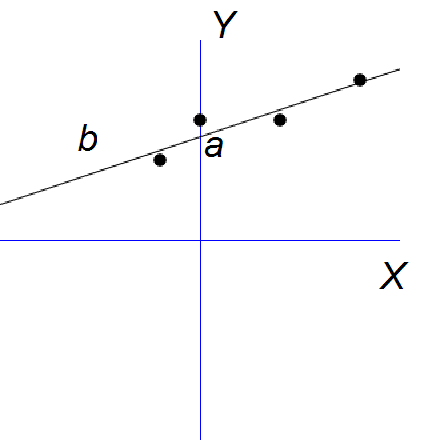
By fitting a model to existing data, we can see if our hunches about these relationships are correct and even quantify them. For instance, we could find that for every $1,000 increase in ad spending, sales tend to increase by $5,000. This kind of insight is crucial for making informed decisions.
Simple vs. Multiple Regression
Regression models can be straightforward or complex, depending on how many independent variables are included. The two main types are simple and multiple regression.
Simple regression uses a single independent variable to predict a dependent variable. It's the most basic form of regression.
Let's say we want to predict a student's final exam score based only on the number of hours they studied. We have one dependent variable (exam score) and one independent variable (hours studied). The relationship can be described with a simple line.
Multiple regression uses two or more independent variables to predict a dependent variable. This often provides a more realistic model, since real-world outcomes are rarely influenced by just one factor.
To improve our prediction of the exam score, we could add more independent variables, such as hours of sleep the night before the exam and the student's previous GPA. The equation just expands to include these new variables.
| Feature | Simple Regression | Multiple Regression |
|---|---|---|
| Independent Variables | One | Two or more |
| Purpose | Models the relationship between two variables | Models the relationship between a dependent variable and several independent variables |
| Equation | ||
| Visualization | A 2D scatter plot with a line | Harder to visualize (requires 3D or more) |
Understanding the difference between simple and multiple regression is the first step in using this powerful tool to uncover the stories hidden in your data. Now, let's check your understanding of these core concepts.
What is the primary purpose of regression analysis?
A coffee shop owner wants to predict daily sales based on the day's temperature and whether it's a weekday or weekend. Which type of regression is most appropriate?
With these basics in hand, you're ready to explore how these models are built and interpreted.