Mastering Microsoft Power BI for Data Insights
Introduction to Power BI
What Is Power BI?
Power BI is a tool from Microsoft that helps people make sense of data. Think of it as a powerful lens that can take raw, confusing numbers from spreadsheets, databases, or cloud services and turn them into clear, interactive visuals. Instead of staring at endless rows of data, you can see charts, graphs, and maps that tell a story.
Power BI is a data visualization and business intelligence tool that allows users to connect to various data sources, clean and transform data, and build visual dashboards that tell compelling data stories.
This process of turning data into actionable information is called business intelligence, or BI. The goal is to spot trends, find insights, and make smarter decisions. Power BI puts this capability into the hands of not just data analysts, but anyone in an organization who needs to understand their data better.
The Power BI Ecosystem
Power BI isn't just one single program. It's a collection of services and apps that work together, allowing you to create, share, and consume business insights in the way that best suits you. There are three main parts to this ecosystem.
Power BI is far more than just a data visualization tool; it represents a powerful ecosystem that includes Power BI Desktop, Power BI Service, and Power BI Mobile.
Power BI Desktop This is a free application you install on your Windows computer. It's the primary workshop for building reports. Here, you connect to your data sources, shape the data to be useful, and design the visuals that will eventually become your report or dashboard.
Power BI Service This is the cloud-based part of Power BI, also known as Power BI Pro. Once you've built a report in Power BI Desktop, you publish it to the Service. This is where you can share your reports with colleagues, assemble dashboards, and collaborate with your team. It’s accessible through any web browser.
Power BI Mobile Apps As the name suggests, these are apps for your phone and tablet (iOS, Android, and Windows). They provide a secure, live view of your reports and dashboards from the Power BI Service, so you can stay on top of your data from anywhere.
A Quick Tour of the Interface
When you first open Power BI Desktop, you'll see a clean interface designed for building reports. You don't need to know every button right away, but it helps to get familiar with the main areas.
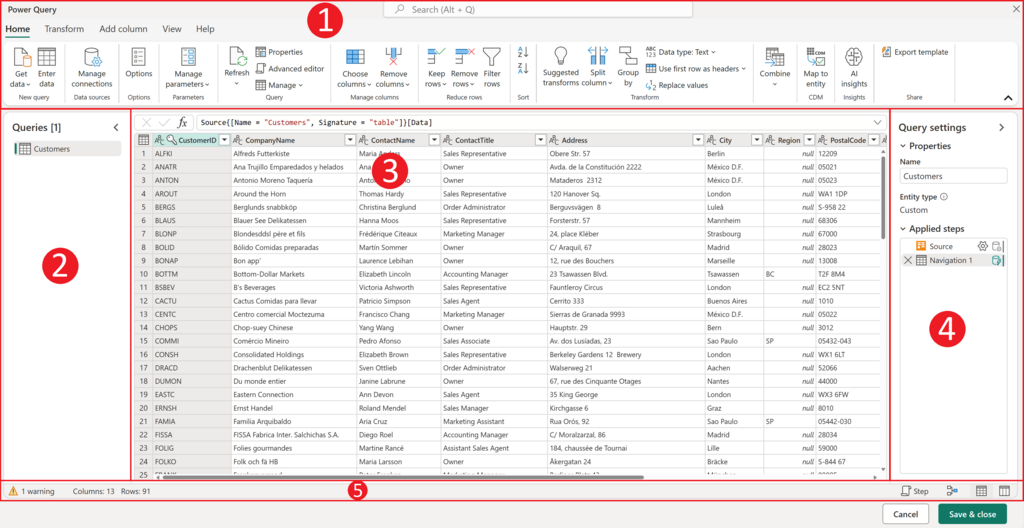
The main canvas in the center is where you'll arrange your visuals. On the right side, you'll find three important panes:
- Fields: This pane lists all the tables and data fields you've connected to. You'll drag items from here onto the canvas to start building visuals.
- Visualizations: This is your toolbox for charts and graphs. You can choose from bar charts, pie charts, maps, and more, then customize their appearance.
- Filters: Here, you can add filters to your entire report, a specific page, or just a single visual, allowing you to narrow down the data being shown.
On the left side of the screen, you'll see three icons that let you switch between different views:
- Report View: The default view, where you build your report pages.
- Data View: Lets you see the underlying data in a table format, similar to a spreadsheet.
- Model View: Shows you how your different data tables are related to each other.
Understanding this basic layout is the first step toward creating your own data stories.
With these components, you can go from raw data to a shared, interactive dashboard that helps your whole team make better decisions.