Mastering Market Dynamics and Strategy
Advanced Technical Indicators
Beyond the Basics
You already know that indicators can signal if a market is overbought or oversold. But that's just scratching the surface. Advanced indicators don't just tell you what's happening now; they offer clues about what might happen next. By looking for subtle disagreements between price and momentum, you can spot potential trend reversals before they become obvious.
The goal is to move from reacting to the market to anticipating its moves.
Reading the Momentum
Let's start with the (RSI). Instead of just watching for moves above 70 or below 30, we'll look for divergence. This is when the price and the RSI tell two different stories. It's a powerful signal that the underlying momentum is fading.
There are two main types:
- Bullish Divergence: The price of an asset makes a new low, but the RSI makes a higher low. This suggests that while the price is falling, the selling pressure is weakening. A potential upward reversal could be on the horizon.
- Bearish Divergence: The price makes a new high, but the RSI makes a lower high. This hints that the buying momentum is running out of steam, and a downward turn might be coming.
Similarly, the (MACD) indicator gives us more than just crossover signals. The real insight often comes from its histogram, which measures the distance between the MACD line and the signal line.
When the histogram bars start getting shorter, it means the momentum of the current trend is slowing down. For example, if a stock is in a strong uptrend and the histogram peaks and then begins to shrink toward the zero line, it's a warning that the upward momentum is fading, even if the price is still rising. This can be an early signal to tighten your stop-loss or consider taking profits.
Gauging the Market's Mood
Price direction is only one part of the puzzle. Volatility, or the speed and magnitude of price changes, is just as crucial. The Average True Range (ATR) is the perfect tool for this. It doesn't tell you which way the price will go, but it tells you how wild the ride might be.
A rising ATR indicates increasing volatility, often seen during panic selling or sharp rallies. A falling ATR suggests a quieter, consolidating market. A common practical use is setting stop-losses. For example, a trader might place a stop-loss at a distance of 2x the current ATR value below their entry price for a long position. This adapts the risk management to the market's current volatility instead of using a fixed percentage.
Squeeze and Breakout
Finally, let's look at , which consist of a moving average plus upper and lower bands that are typically two standard deviations away. While they are great for identifying overbought/oversold levels, their real power lies in spotting the "Squeeze."
A Squeeze occurs when the bands narrow significantly, indicating a period of very low volatility. This is often the calm before the storm. The market is consolidating and building energy for its next major move. When the price eventually breaks out of this narrow range with high volume, it often signals the start of a new, powerful trend. Traders watch for this Squeeze and wait for a decisive breakout above the upper band or below the lower band to enter a trade.
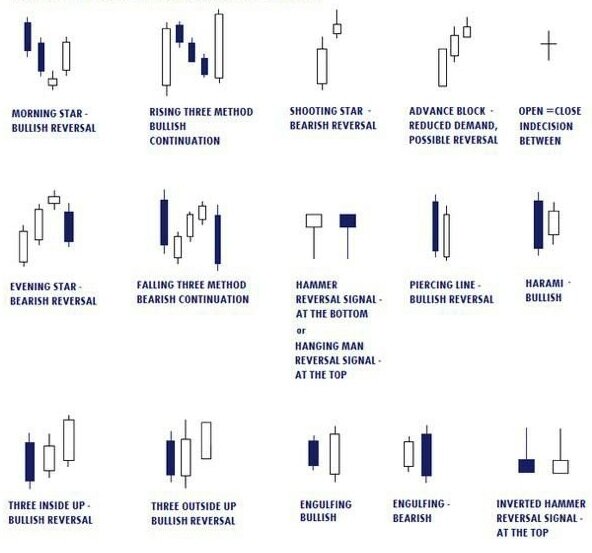
These advanced techniques transform indicators from simple gauges into predictive tools. By understanding divergence, momentum shifts, and volatility patterns, you can develop a more nuanced and forward-looking approach to the market.
Ready to test your knowledge?
A stock's price has just hit a new low, but the Relative Strength Index (RSI) is showing a higher low compared to its previous trough. What does this signal potentially indicate?
In a strong uptrend, you notice the bars on the MACD histogram are getting progressively shorter, even though the price is still rising. What is this a warning sign of?
By combining these tools, you can build a robust system for analysing market behaviour.