Mastering Market Dynamics and Strategic Trading
Advanced Fundamental Analysis
Beyond the Ticker Price
A stock's price tells you what you have to pay. It doesn't tell you what the business is worth. To bridge that gap, we use financial ratios. These are tools for looking under the bonnet of a company to assess its health and future prospects, helping you distinguish a fair price from market hype.
We'll focus on three key metrics that work together: the Price-to-Earnings (P/E) ratio to gauge market sentiment, the Price/Earnings-to-Growth (PEG) ratio to value growth, and Earnings Per Share (EPS) to measure profitability. These tools are essential for uncovering a company's intrinsic value, a concept that forms the bedrock of fundamental analysis.
Reading the Market's Mind with P/E
The Price-to-Earnings ratio is the most common valuation metric. It tells you how much investors are willing to pay for each pound of a company's earnings. A high P/E suggests the market expects strong future growth, while a low P/E might indicate lower expectations or that the stock is undervalued.
But not all P/E ratios are the same. You need to know if you're looking at the past or the future.
-
Trailing P/E uses earnings from the previous 12 months. It's based on actual, reported numbers, so it's accurate. However, it's backward-looking and doesn't account for what might happen next.
-
uses estimated earnings for the next 12 months. This is more relevant for gauging future potential, but it's based on analysts' predictions, which can be wrong. A significant drop from trailing to forward P/E suggests analysts expect earnings to grow substantially.
Finding Growth at a Reasonable Price
A high P/E ratio isn't necessarily bad if the company is growing quickly. But how do you know if the growth is worth the price? That's where the PEG ratio comes in. It refines the P/E ratio by factoring in the company's expected earnings growth rate.
The PEG ratio provides crucial context. A common rule of thumb is that a PEG ratio below 1.0 suggests a stock may be undervalued relative to its growth prospects. A value above 1.0 could signal it's overvalued. This is particularly vital in 2026. The AI-driven supercycle has pushed P/E ratios for many tech firms to historic highs. The PEG ratio helps you determine if you're paying a premium for genuine, rapid growth or just getting caught up in the hype.
For example, two AI companies both have a P/E of 40. Company A is expected to grow earnings by 50% next year (PEG of 0.8), while Company B is expected to grow by 20% (PEG of 2.0). The PEG ratio immediately flags Company A as potentially the better value.
The Quality of Your Earnings
Earnings Per Share (EPS) is the engine that drives both P/E and PEG ratios. It's a direct measure of a company's profitability allocated to each share of stock. But not all earnings are created equal.
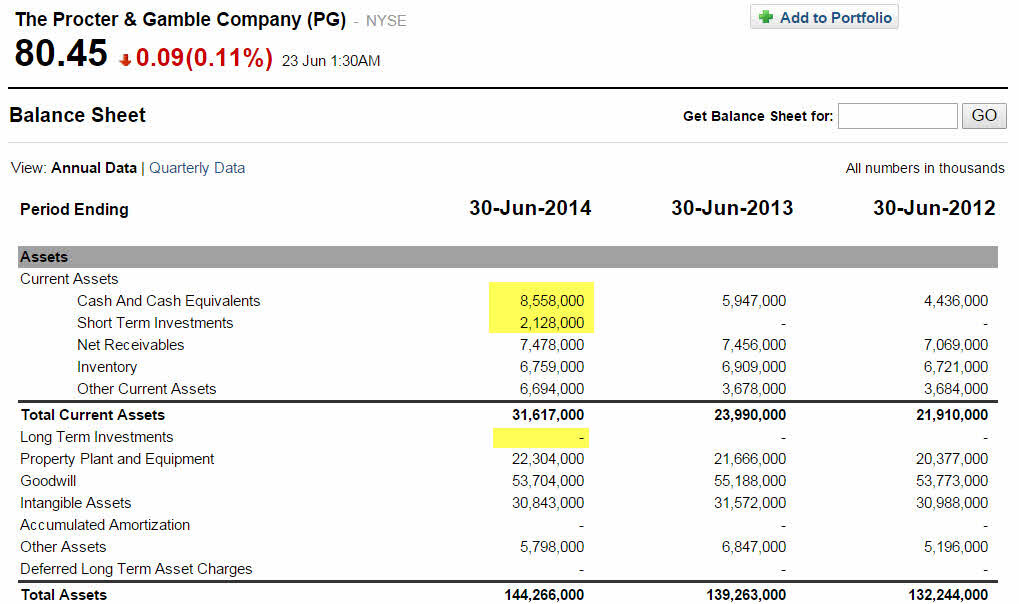
You need to look for earnings quality and consistency. A company with a smooth, steadily increasing EPS year after year is often a more reliable investment than one with volatile earnings that jump around. Sudden spikes in EPS might be due to one-off events, like selling an asset, rather than sustainable improvements in the core business. These are considered low-quality earnings.
In today's market, there's a pivot towards sectors tied to 'physical reality'—like basic materials and utilities—as the world builds out the infrastructure for AI and electrification. Valuations in these sectors are typically lower than in tech. A utility might have a P/E of 15, while a basic materials company might be at 12. These benchmarks are your starting point. Using these ratios, you can screen for companies trading at a discount to their industry peers, potentially uncovering opportunities the market has overlooked.
Ready to test your understanding of these key valuation metrics?
What does a high Price-to-Earnings (P/E) ratio generally suggest about a company?
An analyst observes that a tech company's Trailing P/E is 35, while its Forward P/E is 25. What is the most likely reason for this difference?
By combining P/E, PEG, and a qualitative check on EPS, you move from simply reading prices to actively analysing value. This methodical approach helps you form an evidence-based opinion on a stock, which is the core of smart investing.