Mastering Market Dynamics and Investment Strategy
Market Mechanics
Beyond the Ticker Tape
You already know what a stock is and why its price changes. But what happens in the milliseconds between a news event and the price on your screen updating? The real action isn't on a chart; it's inside the market's engine room: the order book.
The is a live, digital list of all buy and sell orders for a specific stock. It’s organized by price level. On one side, you have the bids, which are orders to buy. On the other, you have the asks (or offers), which are orders to sell. The market is a constant negotiation between these two sides.
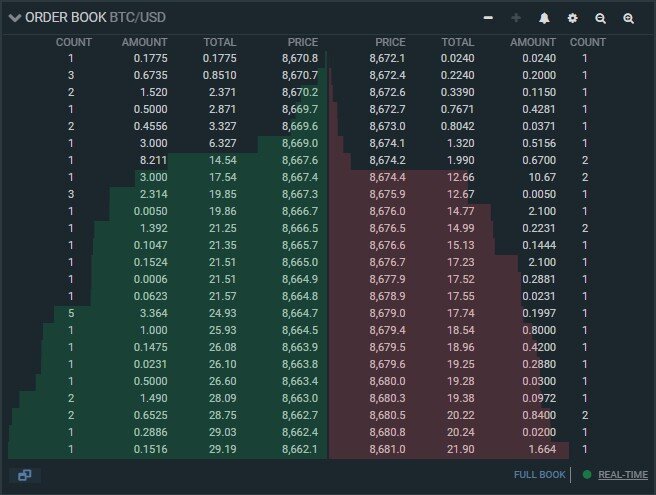
The highest price a buyer is willing to pay is the best bid. The lowest price a seller is willing to accept is the best ask. The difference between these two prices is the bid-ask spread. For a trade to happen, someone has to cross the spread. Either a buyer agrees to pay the seller's ask price, or a seller agrees to accept a buyer's bid price.
| Bid (Buy Orders) | Ask (Sell Orders) | |
|---|---|---|
| Price (₹) | Quantity | Price (₹) |
| 100.00 | 500 | 100.05 |
| 99.95 | 800 | 100.10 |
| 99.90 | 1200 | 100.15 |
In this example, the bid-ask spread is ₹0.05 (₹100.05 - ₹100.00). To buy 100 shares immediately, you would have to pay ₹100.05 per share.
Liquidity and Market Depth
The tables above show more than just the best prices. They show market depth—the volume of orders waiting at different price levels. A market with deep liquidity has a large number of buy and sell orders stacked up. This is crucial because it means you can execute large trades without significantly impacting the stock's price.
Imagine you want to sell 1,000 shares of the stock from our example. The best bid is for only 500 shares at ₹100.00. To sell all your shares immediately, you'd sell 500 at ₹100.00, and the next 500 would have to be sold to the next best bid, which is at ₹99.95. Your average sale price wouldn't be ₹100.00, but slightly lower. This price difference is called slippage and it is an implicit cost of trading.
Slippage is a bigger issue for institutional investors trading large blocks of shares than for retail investors. However, it can also affect retail traders in fast-moving or thinly traded markets where liquidity is low. The cost of this impact is a very real factor in trading profitability.
The Speed of the Game
So who is creating all these orders? A significant portion of daily trading volume now comes from (HFT) firms. These firms use powerful computers and complex algorithms to execute a massive number of orders at extremely high speeds.
HFT algorithms operate on timescales invisible to humans. They might place and cancel thousands of orders per second. One common HFT strategy is market making. The algorithm simultaneously places a bid and an ask, aiming to profit from the spread. By providing constant liquidity, they ensure there are always buyers and sellers available, which generally tightens the bid-ask spread for everyone else.
This algorithmic activity is a major reason why prices can fluctuate throughout the day, even without major news. It's the digital hum of millions of micro-negotiations happening every second.
Understanding these mechanics—the order book, liquidity, slippage, and the role of algorithms—moves you from a passive observer of prices to an informed market participant. You can now see the forces that create the price action on your charts.
Time to test your understanding of how the market really works.
What is the 'order book' in the context of stock trading?
The difference between the highest price a buyer is willing to pay (best bid) and the lowest price a seller is willing to accept (best ask) is known as the: