Mastering Linear Regression with Python and Excel
Linear Regression Fundamentals
Finding the Straight Line
Linear regression is a way to find a straight-line relationship between two or more variables. Think of it as drawing the best possible line through a scatter plot of data points. We use it to predict a value or understand how one thing affects another.
For example, we could use it to predict how much ice cream a shop will sell based on the day's temperature. The temperature is the independent variable (the input), and the ice cream sales are the dependent variable (the output we're trying to predict).
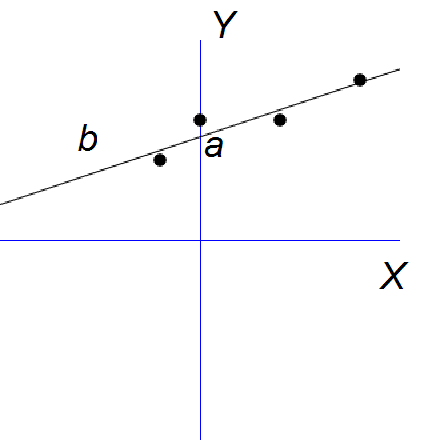
The goal is to find the equation of a line that minimizes the overall distance from the line to all of the data points. This line is described by a simple equation you might remember from algebra.
Rules of the Road
For a linear regression model to be reliable, the data needs to follow a few rules. These are called assumptions. If your data violates these assumptions, your model's predictions might not be accurate.
Think of these assumptions as a quality check. They ensure that the relationship you've found is real and not just a coincidence in the data.
| Assumption | What it Means |
|---|---|
| Linearity | The relationship between the independent and dependent variables is linear (a straight line, not a curve). |
| Independence | The errors (residuals) are independent. One error doesn't tell you anything about the next. |
| Homoscedasticity | The errors have a constant variance. The spread of the errors should be consistent across all values of the independent variable. |
| Normality of Errors | The errors are normally distributed. This means they follow a bell-shaped curve around zero. |
Making Sense of the Output
Once we build a model, we get a few key numbers that tell us what it found. The most important are the coefficients and a value called R-squared.
Coefficient
noun
A numerical value that measures the impact of an independent variable on a dependent variable.
The coefficient, our , is the slope of the line. It tells us the strength and direction of the relationship. A positive coefficient means that as the independent variable goes up, the dependent variable also tends to go up. A negative coefficient means the opposite.
Next, we need to know how well our model actually fits the data. That's where R-squared comes in.
R-squared () measures the proportion of the variance in the dependent variable that is predictable from the independent variable(s). It's a number between 0 and 1.
An R-squared of 0 means the model explains none of the variability in the data. An R-squared of 1 means it explains all of it. In our example, an of 0.75 would mean that 75% of the variation in ice cream sales can be explained by the temperature.
What the Errors Tell Us
No model is perfect. The difference between the actual observed value and the value predicted by the model is called the residual. It's the error for that specific data point.
If our model predicted a shop would sell 480 ice creams on a hot day, but they actually sold 500, the residual for that day is +20. Analyzing these residuals is crucial. It helps us check if we met the assumptions we talked about earlier. We look at plots of the residuals to see if there are any patterns.
If the residuals are randomly scattered around zero, it's a good sign. It suggests our linear model is a good fit. But if we see a pattern, like a curve or a funnel shape, it tells us something is wrong. The relationship might not be linear, or we might have violated another assumption.
What is the primary goal of simple linear regression?
In a model predicting a car's fuel efficiency (miles per gallon) based on its weight, the car's weight is the ________ variable.
Understanding these fundamentals is the first step toward using linear regression effectively. It's about more than just plugging numbers into software; it's about interpreting the results and knowing when to trust them.