Mastering Indian Equities and Market Analysis
Advanced Financial Statement Analysis
Beyond the Headlines
A company's stock price tells you what people think it's worth, but its financial statements tell you why. To truly understand a business, you need to go beyond the daily market chatter and learn to read these reports. They are the three pillars of financial analysis: the Profit & Loss (P&L) statement, the Balance Sheet, and the Cash Flow Statement. Each tells a different part of the company's story, and together they paint a complete picture of its health.
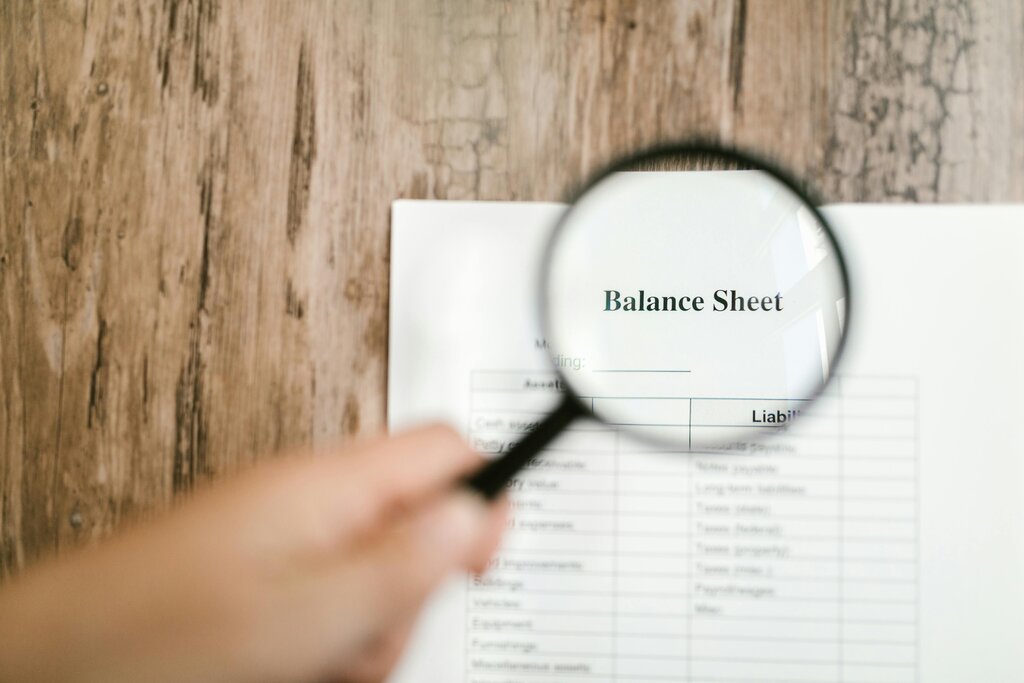
Think of them as a doctor's report for a business. The P&L is like checking its metabolism over a period, the Balance Sheet is a full-body scan at one moment, and the Cash Flow statement is like monitoring its circulatory system. Let's look at how to analyze each one.
The Profit & Loss Story
The P&L statement, or Income Statement, summarises a company's revenues, costs, and expenses during a specific period, like a quarter or a year. The famous "bottom line" is here: net profit. But the real insights are in the details.
Don't just look at total revenue. Dig deeper. Where is it coming from? Is it from a single product, or is it diversified? Is it growing consistently? A sudden, unexplained jump in revenue can be a red flag for , where a company might record sales before the money is actually earned. This can make performance look better than it really is.
On the expense side, are costs under control? Are they growing slower or faster than revenue? A healthy company typically sees its revenues grow faster than its costs. To get the most current picture, analysts often use data, which smooths out seasonal bumps and gives a more up-to-date view than a simple annual report.
Assets, Liabilities, and Balance
The Balance Sheet is a snapshot in time. It shows what a company owns (Assets) and what it owes (Liabilities). The difference is the Shareholders' Equity. The fundamental equation is simple: Assets = Liabilities + Equity.
But not all assets are created equal. Cash is great, but an asset like 'Goodwill' (the premium paid for an acquisition over its book value) can be subjective and may be written down later. Look for the quality of assets. Is inventory piling up faster than sales? Are customers taking longer to pay their bills (rising accounts receivable)? These can be signs of trouble.
On the other side, watch out for ballooning debt. A company taking on a lot of debt to fuel growth can be risky. If profits falter, those debt payments can become a huge burden. A key task is to compare the level of debt to the company's equity and its ability to generate cash to pay it back.
Follow the Cash
Profit is an opinion, but cash is a fact. This is where the Cash Flow Statement (CFS) comes in. It tracks the actual movement of cash in and out of a company and is arguably the most important of the three statements. A company can show a profit on its P&L but still go bankrupt if it runs out of cash.
The CFS is split into three parts:
- Cash Flow from Operations (CFO): Cash generated from the company's main business activities. A consistently positive and growing CFO is a very healthy sign.
- Cash Flow from Investing (CFI): Cash used for or generated from investments, like buying equipment (a cash outflow) or selling assets (a cash inflow).
- Cash Flow from Financing (CFF): Cash from activities like issuing new shares (inflow), paying dividends (outflow), or taking on debt (inflow).
The biggest insight comes from comparing Net Profit from the P&L with Cash Flow from Operations. If a company reports high profits but has negative operating cash flow, you need to find out why. It could be that its customers aren't paying their bills, which is a serious problem.
A key part of analysis is understanding how these three statements link together. Net income from the P&L flows into the Balance Sheet's equity, and the Cash Flow Statement explains the change in the cash balance on the Balance Sheet from one period to the next.
One powerful technique for analysis is creating a . This involves stating each line item as a percentage of a base figure. For a P&L, you'd show each expense as a percentage of total revenue. For a Balance Sheet, each asset is shown as a percentage of total assets. This makes it much easier to compare companies of different sizes or to spot trends over time for a single company.
| P&L Item | Year 1 | Common-Size | Year 2 | Common-Size |
|---|---|---|---|---|
| Revenue | ₹1000 | 100.0% | ₹1200 | 100.0% |
| Cost of Goods | ₹600 | 60.0% | ₹780 | 65.0% |
| Gross Profit | ₹400 | 40.0% | ₹420 | 35.0% |
| Operating Exp | ₹200 | 20.0% | ₹220 | 18.3% |
| Net Profit | ₹200 | 20.0% | ₹200 | 16.7% |
In the example above, even though revenue grew and net profit stayed the same in absolute terms, the common-size analysis shows a problem. The cost of goods sold jumped from 60% to 65% of revenue, eroding the company's profitability. This is the kind of insight that looking at raw numbers might miss.
Which financial statement provides a snapshot of a company's assets, liabilities, and shareholders' equity at a single point in time?
If a company's financial report shows a significant increase in revenue, but you suspect it might be due to 'aggressive revenue recognition', what would you look for?
By learning to read and connect these three statements, you move from being a passive observer of market prices to an active analyst of business performance.