Mastering Healthcare Investment Banking Coverage
Biopharma Pipeline Valuation
Valuing the Invisible
How do you value something that doesn't exist yet? That's the core challenge in biopharma. A promising drug in a lab is years and millions of dollars away from being a product on a shelf. Most will fail along the way. Standard valuation methods like a discounted cash flow (DCF) model fall short because they don't properly account for this immense risk.
Risk-adjusted net present value (rNPV) is considered the gold standard for biotech valuation.
The Risk-Adjusted Net Present Value (rNPV) model is the industry's answer. It's a specialized DCF that systematically discounts future cash flows not just for the time value of money, but also for the high probability of clinical and regulatory failure at each stage of development. It forces us to quantify the uncertainty.
The Probability Gauntlet
The heart of the rNPV model is the Probability of Technical and Regulatory Success, or PTRS. This isn't just one number; it's a series of probabilities that a drug will successfully advance from one stage of the clinical trial process to the next. The overall probability of success is the product of these individual phase probabilities.
PTRS
noun
The likelihood that a drug candidate will successfully complete a given clinical trial phase and meet regulatory requirements for approval.
A drug starting in Phase I has a long and uncertain road ahead. The cumulative probability of making it all the way from Phase I to market approval is often surprisingly low, typically in the 10-15% range. These probabilities are derived from historical data of thousands of clinical trials across different therapeutic areas.
| Stage | Probability of Success (Per Phase) | Cumulative Probability (from Phase I) |
|---|---|---|
| Phase I to Phase II | ~60% | 60.0% |
| Phase II to Phase III | ~30% | 18.0% |
| Phase III to Approval | ~60% | 10.8% |
| Approval to Launch | ~90% | 9.7% |
As you can see, the biggest hurdle is typically Phase II, where a drug's efficacy is tested for the first time in patients. A failure here wipes out all future potential. The PTRS is the adjustment factor we apply to our financial projections.
Projecting Peak Sales
With our risk dialed in, we can focus on the potential reward: sales. We don't project revenue year by year from the start. Instead, we estimate the drug's revenue in its single best year, known as Peak Year Sales (PYS). This figure is the anchor for our entire cash flow model.
Once we have the PYS, we can model the sales ramp up to that peak and, crucially, the decline that follows. This entire stream of potential future cash flows, from R&D costs to peak sales and beyond, is then adjusted by the PTRS for the drug's current phase. A drug in Phase I might have its entire multi-billion dollar potential valued at a fraction of that, because it's only got a ~10% chance of ever seeing the market.
In an rNPV model, R&D and commercialization costs are treated as cash outflows. R&D expenses are modeled phase by phase, and only incurred if the prior phase is successful. This creates a decision-tree-like structure within the valuation.
The Patent Cliff
A drug's profitability is protected by patents. But patents expire. When they do, the company faces a Loss of Exclusivity (LOE). This is not a gradual decline; it's a cliff.
Patent Cliff
noun
The sharp decline in a drug's sales revenue that occurs upon patent expiration and the market entry of generic competitors.
Once generic versions of a drug are available, they can capture 80-90% of the market within a year or two, driving the price down dramatically. In an rNPV model, this is critical for calculating the terminal value. The cash flows don't grow forever. They ramp up, peak, and then fall sharply after the LOE. Correctly modeling this patent cliff is just as important as estimating the peak.
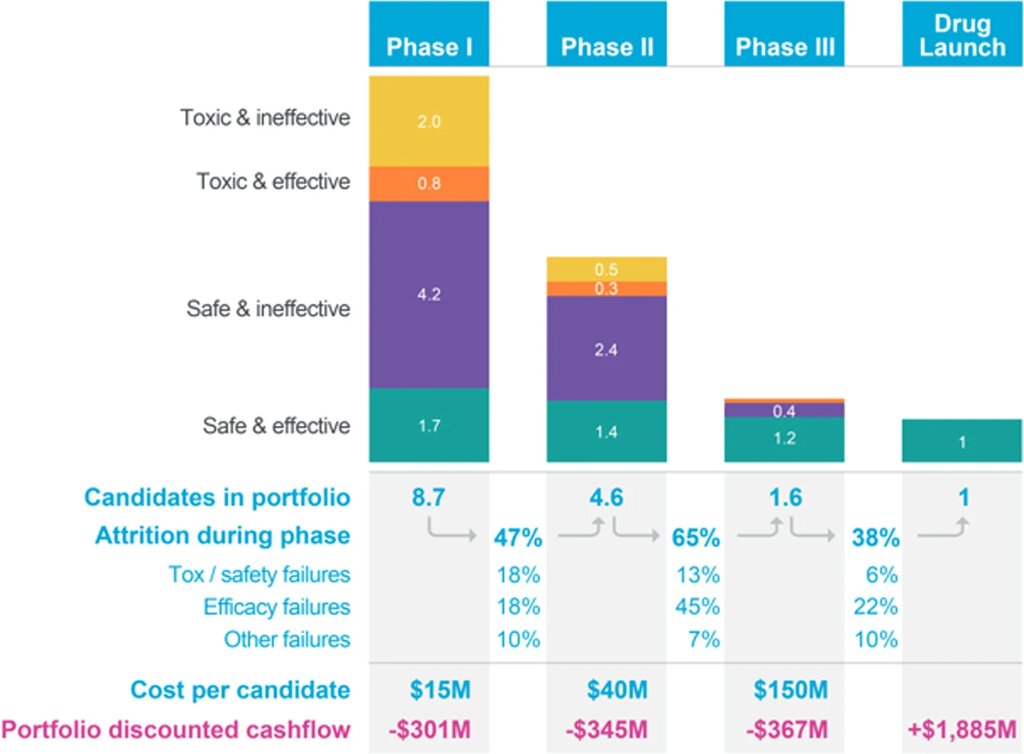
By combining phase-specific probabilities (PTRS), projecting a realistic sales lifecycle around a peak (PYS), and accounting for the eventual drop-off (LOE), the rNPV model provides a disciplined framework for valuing the high-risk, high-reward assets in a biopharma pipeline.
Why is the Risk-Adjusted Net Present Value (rNPV) model preferred over a standard Discounted Cash Flow (DCF) model for valuing early-stage biopharma assets?
The term for a drug's revenue in its single best year, which is used as an anchor for financial projections in an rNPV model, is known as: