Mastering Financial Trading Strategy
Technical Analysis Foundations
Price Is Everything
In technical analysis, the guiding principle is simple: the price chart contains all the information you need. News, earnings reports, and economic data are all reflected in the price you see on the screen. This idea is a cornerstone of , one of the oldest frameworks for analysing markets. It proposes that the market discounts everything, meaning that by the time you read a news headline, the market has already reacted and priced it in.
Instead of asking why a price moved, a technical analyst focuses on how it moved and where it might go next.
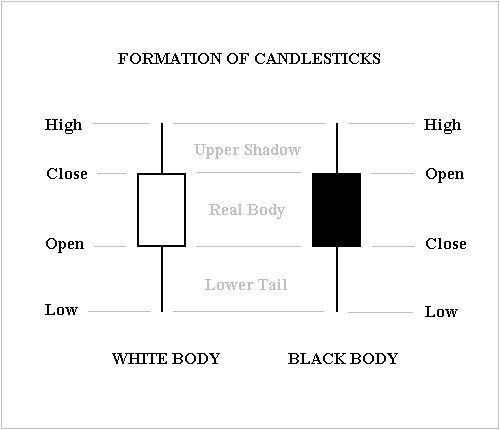
This philosophy frees you from trying to process an infinite stream of global news. Instead, you focus on reading the story told by the price itself. The primary language for this story is the candlestick chart, where each candle represents a chapter of market sentiment over a specific period.
Reading Market Sentiment
Individual candlesticks and patterns can signal shifts in the balance between buyers and sellers. Understanding them is like learning to read the market's body language.
A single candle can tell you a lot. A candlestick, for example, has a very small body, indicating indecision. The opening and closing prices are nearly identical, showing that neither buyers nor sellers could gain control. It’s a pause in the action, often preceding a reversal.
Other patterns involve multiple candles. An Engulfing pattern occurs when a large candle completely overshadows the body of the previous one. A Bullish Engulfing pattern (a large green candle engulfing a small red one) suggests buyers have aggressively stepped in. A Bearish Engulfing pattern is the opposite.
The Hammer is another powerful single-candle signal. It has a long lower wick and a small body at the top. This suggests that sellers pushed the price down, but buyers stormed back to close the price near its open. It often appears at the bottom of a downtrend, signaling a potential reversal.
| Pattern | Type | What It Suggests |
|---|---|---|
| Doji | Reversal / Indecision | A potential turning point is near. |
| Bullish Engulfing | Bullish Reversal | Buyers have overwhelmed sellers. |
| Bearish Engulfing | Bearish Reversal | Sellers have overwhelmed buyers. |
| Hammer | Bullish Reversal | Buyers rejected lower prices. |
Support and Resistance Zones
Instead of thinking about single price points, it's more useful to identify as zones. These are areas on a chart where the price has repeatedly struggled to move past. A resistance zone is an area where selling pressure tends to be strong enough to halt an upward trend. Conversely, a support zone is an area where buying pressure is strong enough to stop a downtrend.
Think of these not as hard lines, but as areas of supply (resistance) and demand (support). When a price breaks through a resistance zone, that zone often becomes a new support level. The psychology shifts: traders who were previously selling at that level may now see it as a good price to buy on a pullback.
Putting It All Together
Technical analysis is not about being right 100% of the time. It’s about putting the odds in your favour. By combining candlestick patterns with support and resistance zones, you can build a more complete picture.
For instance, seeing a Hammer pattern form as the price reaches a strong support zone is a more powerful buy signal than seeing either event in isolation. It suggests that not only is the price at a historical demand area, but recent price action also shows buyers actively defending that level.
Finally, context is everything. A pattern on a daily chart carries more weight than the same pattern on a 5-minute chart. That's why multi-timeframe analysis is crucial. A trader might identify a primary uptrend on a daily chart, then zoom into an hourly chart to find a pullback to a support level, and finally use a 15-minute chart to spot a bullish engulfing pattern for a precise entry.
This layered approach helps you align your trades with the broader market direction, improving your chances of success.
Now, let's test what you've learned about these core concepts.
According to the core principles of technical analysis, what is the significance of a major news announcement about a company?
A candlestick with a very small body, where the opening and closing prices are nearly identical, is known as a Doji. What does this pattern typically indicate?
By mastering these foundational elements, you can start to interpret market behaviour and make more informed trading decisions based on the story the chart is telling you.